Good day my good friend.
Last week was a week pounding the rails. To the point where I was getting rather sick of Thameslink turfing me and other commuters off at Luton and waiting in the pouring rain because the train is running late. The joys of living at what is thought of as an intermediate station.
📕 I have co-authored a book on Mobility-as-a-Service, which is a comprehensive guide on this important new transport service. It is available from the Institution of Engineering and Technology and now Amazon.
💼 I am also available for freelance transport planning consultancy, through my own company Mobility Lab. You can check out what I do here.
🌲 Losing battle
For as long as we have been around, humans have either sought manipulate the natural world to its advantage, and more recently has sought to control it. It has been a staple of civil engineering that natural processes can be managed, diverted, and even stopped through significant engineering projects. In many instances, humans have become reliant on us maintaining that level of control in order to live our lives. Just remember the sheer number of homes that are built directly behind flood defences across the world.
In reality, it is a constant battle that without significant investment, humans will ultimately lose. Seeing plants poke through cracks in the pavement is a stark reminder if you needed it. In some cases, the damage is small and constant. Like the constant freeze and thaw cycle splitting open road and pavement surfaces.
But in a warming world, what comes into play much more are instances where natural forces cause immediate change through sheer brute force. Believe it or not, as the world warms, the average rainfall that we receive may not change that much. What is more likely to happen is that we experience that rainfall in shorter, more intense bursts due to the warmer atmosphere being able to hold more water at any one time.
A couple of weeks ago, I got to experience what this may be like first hand. Many of you may have seen the images of the flooded A421 near Marston Moretaine, which is just a few short miles from me. Here, 6 million litres of water to a depth of nearly 10 feet completely submerged the road. But what you may not know is the weather behind this.

The flooding at Marston Moretaine (Source: Sky News)
The Department for Environment, Food, and Rural Affairs, through its Hydrology Data Explorer, shows what happened on the weekend of 21st / 22nd September, through data from a rain gauge situated barely a mile from my house. What happened that weekend was the most intense period of rainfall I have experienced in many years, and is shown the below data.
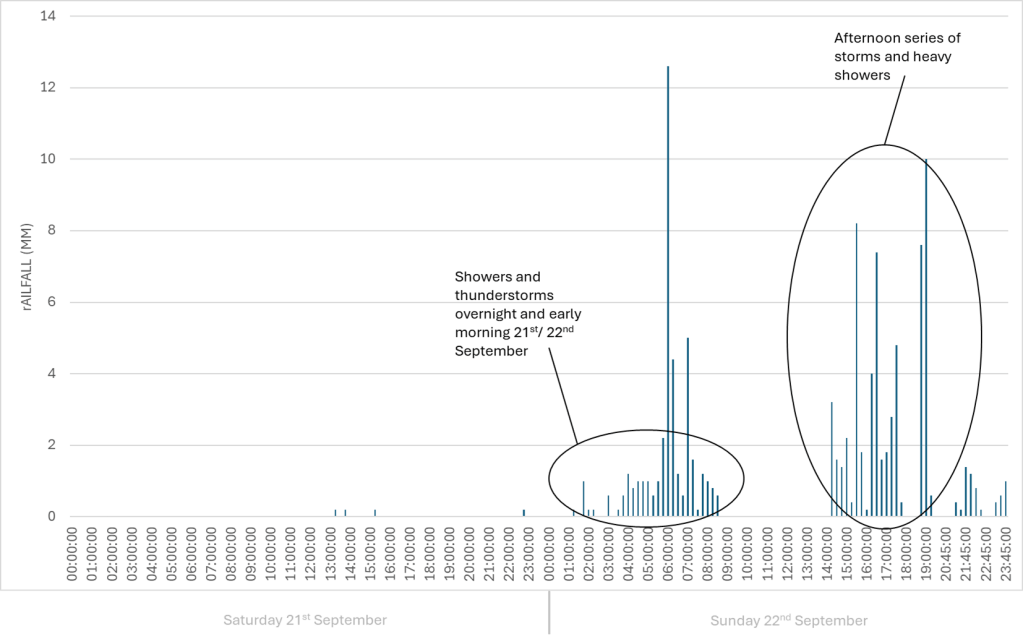
Data for 21st / 22nd September from the Flitwick Rain Guage, with rainfall in mm given at 15 minute intervals (Source: Hydrology Data Explorer, data unverified at time of writing)
While Saturday 21st September was relatively dry, overnight and into the early hours of Sunday morning, the area was hit by a few thunderstorms and some lighter rain showers. The worst being at 6am, when a particularly violent thunderstorm not only woke me and the dogs up, but proceeded to dump half an inch of rain in 15 minutes. This whole episode dumped 1.6 inches of rain in about 6 hours. To give you an idea, on average throughout the whole of September, the nearby Woburn weather station gets 2.2 inches of rain. But this was just the warm up to the main event in the afternoon and early evening.
From 2pm, a line of heavy showers and thunderstorms swept over Bedfordshire. I was monitoring the weather radar, and I counted at least 5 storms hitting Flitwick during this time. Between 2pm and 8pm, a further 2.6 inches of rain fell on already sodden ground. Over two 6 hour periods within 24 hours, 4.2 inches of rain fell, nearly twice the average rainfall for the whole of September.
No wonder roads and railways everywhere flooded. No wonder the A421 has been a lake for nearly 10 days now. No wonder the Rivers Flit, Ivel, Great Ouse, and Ouzel burst their banks.
The effect that such events has on infrastructure is different to that which gradually erodes infrastructure in a constant, predictable manner. Here, infrastructure gets overwhelmed with pure destructive power that has the potential to cause great damage in a short space of time in a manner that causes irreversible change.
Another example that I – like many others who lived in North Devon – was brought up on was the story of the Lynmouth Flood. On August 15th 1952, 9 inches of rain fell in a day on the surrounding hills. Unable to absorb that level of rain, the water rushed into the rivers along with vegetation and boulders. The build up of water swept away bridges as it made its way downstream, and eventually a 60 feet wall of water crashed into the village of Lynmouth, killing 34 people. The village was all but wiped out, not that you would guess when you grab an ice cream on the sea front now.
A sudden, destructive force changing the landscape and its infrastructure forever. We like to think that the effects of climate change on infrastructure are gradual. And to some extent they are. But what we need to plan for is not just recovering from such destructive events, but making the choice as to whether to rebuild or not. As sometimes, the rebuild may not be worth the effort.
For you see, resilience is not just about protecting infrastructure and doing maintenance on it. It is the willingness to make a tough call on the future of infrastructure and places. That is part of our future now. We had better get ready for it.
👩🎓 From academia
The clever clogs at our universities have published the following excellent research. Where you are unable to access the research, email the author – they may give you a copy of the research paper for free.
TL:DR – EVs improve the overall energy efficiency of the transport system.
Investigating contestation around neighbourhood scale active travel infrastructure policy
TL:DR – Talk to more people, get more support.
TL:DR – To deliver policies needed to achieve a 1.5C world, barely 30% of people would have their ‘travel needs’ satisfied.
Temperature and electric vehicle adoption: A ZIP code-level analysis in the US
TL:DR – Temperature variation could predict EV adoption.
📺 On the (You) Tube
I can safely say that if this project was put in front of the Treasury, it would never be funded.
🖼 Graphic Design
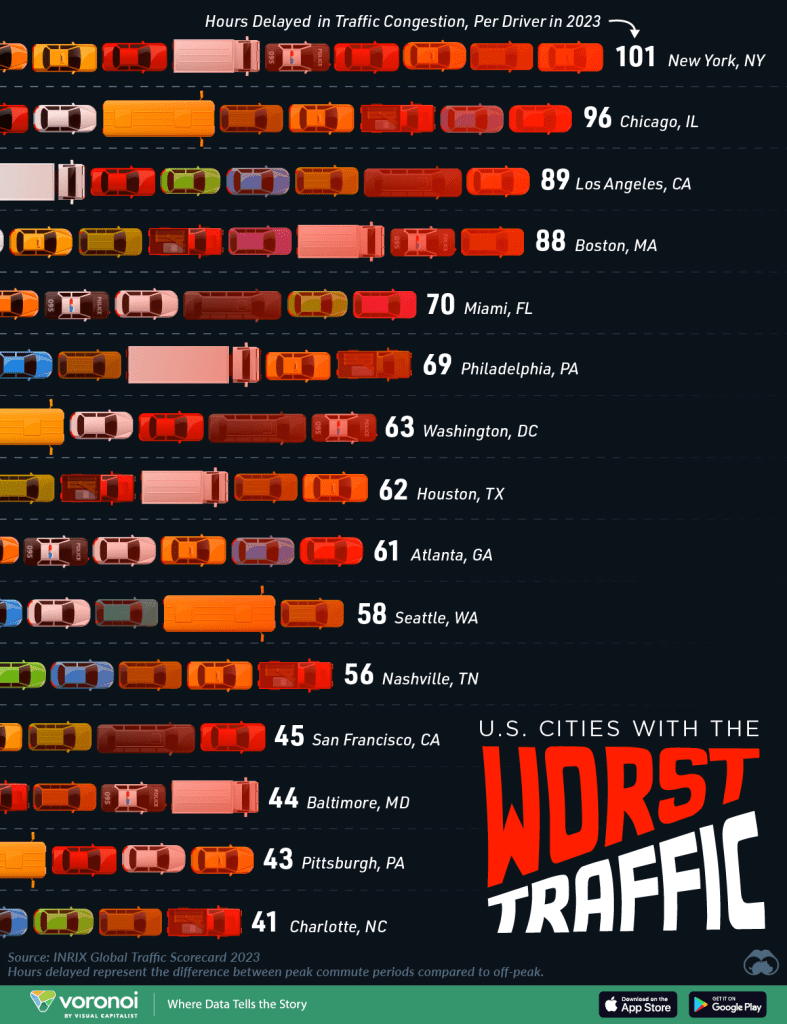
Worst US cities for traffic (Source: Visual Capitalist)
Turns out that traffic congestion is pretty bad across the US.
📚 Random things
These links are meant to make you think about the things that affect our world in transport, and not just think about transport itself. I hope that you enjoy them.
- Hurricane Helene Shows How Broken the US Insurance System Is (Wired)
- Why and Where Africa Needs More Rail and Roads (Econlife)
- El Niño pattern can bring wet weather to UK one year later (New Scientist)
- Misinformed about misinformation (Undercover Economist)
- Road infrastructure boosts competition which affects formal and informal sector firms differently (VoxDev)
👍 Your feedback is essential
I want to make the newsletter better. To do this, I need your feedback. Just fill in the 3 question survey form by clicking on the below button to provide me with quick feedback, that I can put into action. Thank you so much.