
Good day my good friend.
Bloody Nora. It’s only Mobility Camp in York on Friday. To say I am excited is a slight understatement! For those of you who have tickets, I will see you there. For those of you who haven’t, clear your diary, book a ticket, book your train, and see you there!
Mobility Camp is back, and the number one transport unconference is heading to York on Friday 20th September. Book your tickets now! 🎫
I have co-authored a book on Mobility-as-a-Service, which is a comprehensive guide on this important new transport service. It is available from the Institution of Engineering and Technology and now Amazon. 📕
🧮 More than meets the eye
A few weeks back, the latest results from the National Travel Survey for 2023 were released by the Department for Transport. Being the closest thing that transport statistics in the UK has to a bible, it caused a stir. From my LinkedIn timeline, this was mainly from people bemoaning declining cycling trips.
As always, once you dive into the data, you will find that the truth is much more nuanced than that. While the picture for sustainable transport is not as rosy as it could be, nor is it as bad. Now that I have had a chance to delve into the data, here are some things that you may have missed.
The Brits are driving less, not driving as far, and car ownership seems to have plateaued
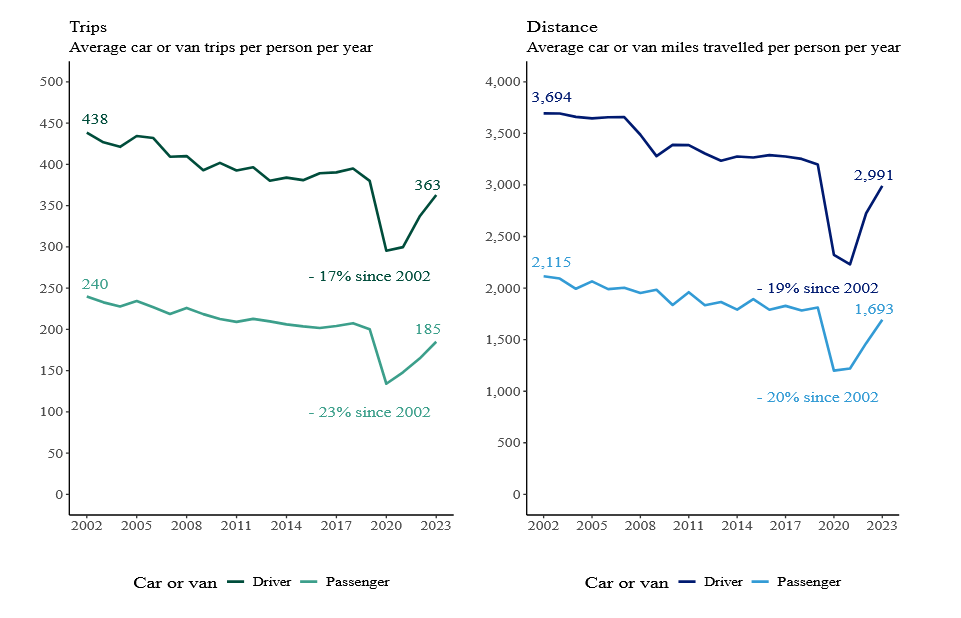
Average car trips and miles travelled (as driver or passenger), per person per year: England, 2002 to 2023 (Source: NTS0303)
There is still evidence of a post-COVID rebound in car trips and average distance driven per person per annum. But we need to remember that the average Brit is driving or being a passenger in a car much less compared to the turn of the century. Taking around 17% less car trips per person per annum as a driver, and driving 19% fewer kilometres per annum.

Percentage of households by car access: Great Britain (1971 to 1988) and England (1989 to 2023) (Source: NTS0205)
When it comes to car ownership, things have been somewhat stable for a while, with variances of only a few percent. The percentage of households with one car or van has hovered at around 44% since 1971. The percentage of households with two or more cars or vans has jumped around the low 30s% since 2002, though the percentage of households with no car or van has declined from the mid 20s% to the low 20s% since 2002.
What I find very interesting is what has happened since COVID-19. Namely, it seems that some people owning two or more cars or vans sold them off and may not have come back to a significant degree. Meanwhile, people without a car or van seemed to become vehicle owners during COVID-19, but this seems to be starting to be corrected, with non-car ownership creeping back up slowly.
We are walking more
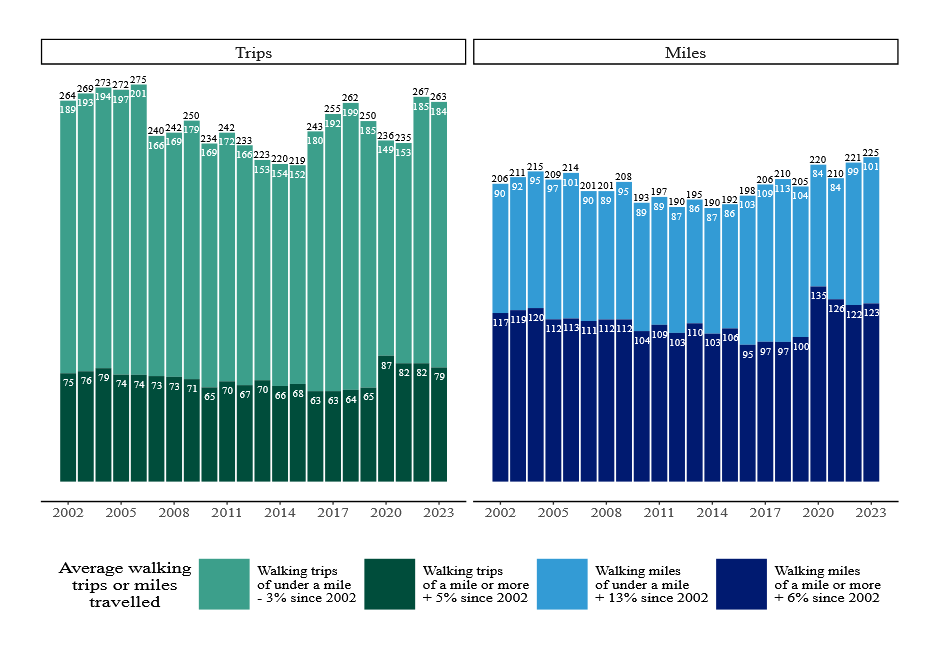
Average walking trips and miles travelled, including walking of a mile or more, per person per year: England, 2002 to 2023 (Source: NTS0303)
The low point for walking trips and miles covered was in 2015. Since that point, the average number of walking trips and miles covered has only gone up. This has been the great success in active travel. While cycling often gets the attention and the money, it seems us transport professionals have been doing much more to get people to use their own two feet.
Public transport is recovering, but its still way down compared to 20 years ago
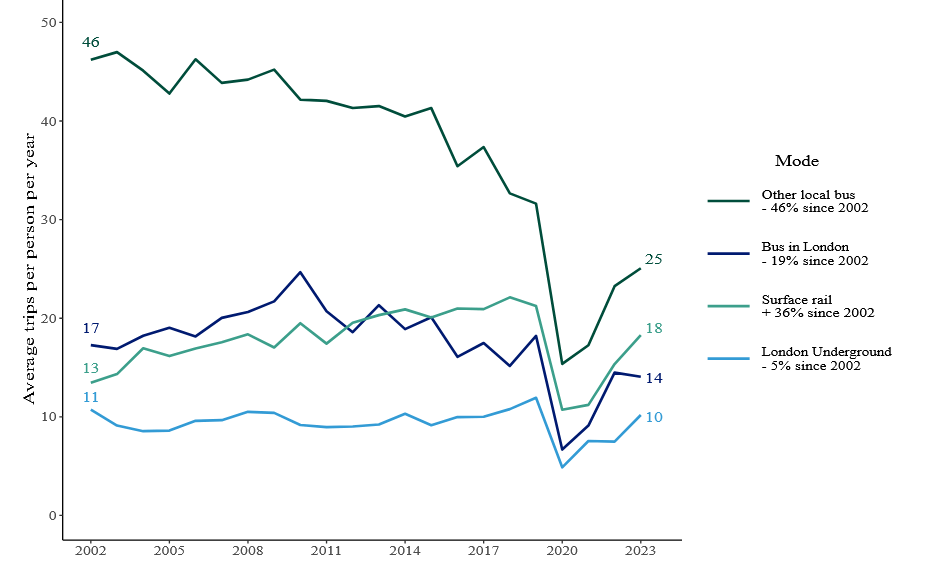
Trips per person per year by selected public transport modes: England, 2002 to 2023 (Source: NTS0303)
Since 2002, the only mode of transport which has more trips per person per annum is surface rail, going from 13 in 2002 to 18 in 2023. Buses outside of London has seen the biggest decline, from 46 in 2002 to 25 in 2023. So public transport is struggling a fair amount.
Women travel more than men do, and take more trips across nearly all modes
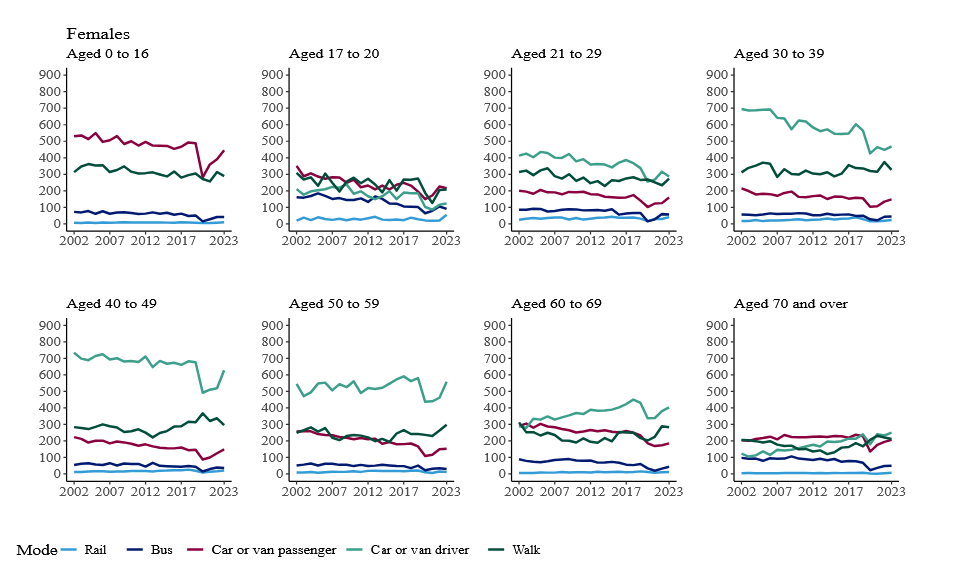
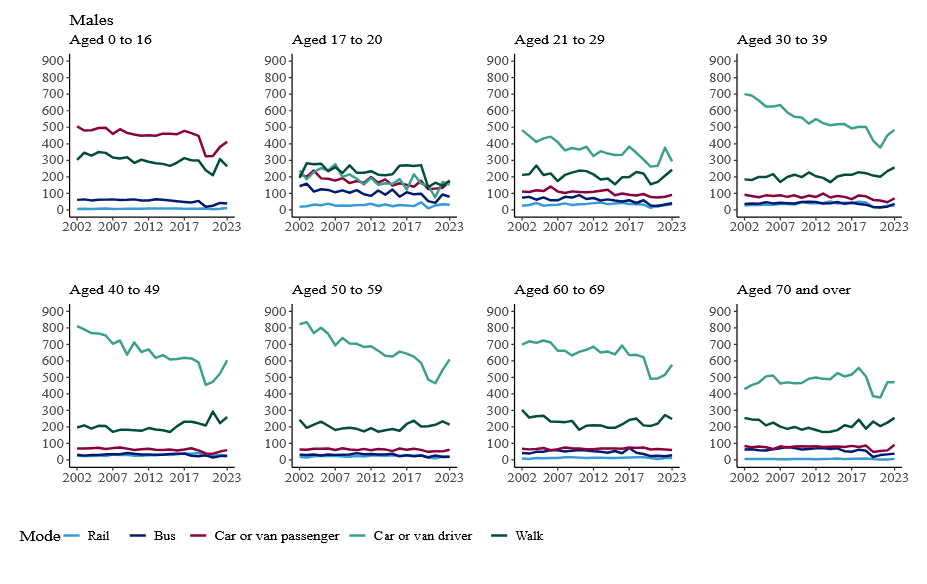
Average trips by sex, age and selected main modes: England, 2002 to 2023 (Source: NTS0601)
It has been known for some time that men take fewer trips than women, but tend to travel further on average. Men are also more likely to cycle compared to women. But for almost every other mode of transport, women travel more, and that is largely consistent across age groups.
Its times like this that we need to remember that travel habits reflect the lives of people. So the observed data here reflects the different lives of men and women in the UK.
Those on the highest incomes travel more, but now no group makes more than 1000 trips per annum
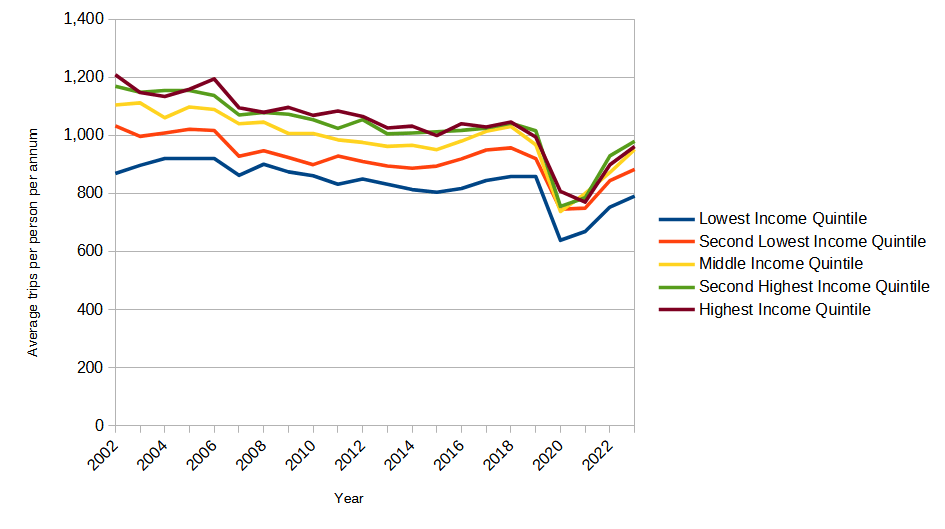
Average number of trips per annum by income quintile, England (Source: NTS0705)
Back in 2002, only the members of households in the lowest income quintile of those surveyed made less than 1000 trips per person per annum on average. Now that is the same for every income quintile. In fact, the number of trips by those in the highest income quintile has dropped the most since 2002, by 20% compared to 8% for the lowest income quintile.
People with mobility difficulties have not recovered to the same extent as those with no mobility difficulties

Average number of trips per person per annum by mobility status, England, 2007-2023 (Source: NTS0709)
For a long time, people with mobility difficulties have taken fewer trips on average every year than those without mobility difficulties. But what has been interesting is how the number of trips for those with mobility difficulties has not recovered as much as those with no mobility difficulties. With the former trips flatlining between 2022 and 2023.
People in the North East and South West walk the most
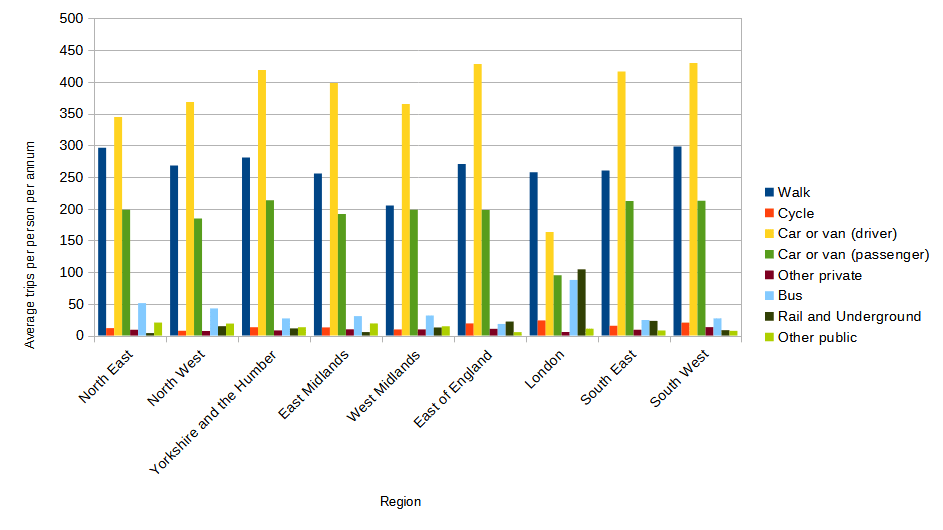
Trips by mode of transport by region, England, 2003 (Source: NTS9903)
There are well know differences between the English regions in terms of public transport use (London usually travels more by public transport) and car use (East and South East England drive the most). But did you know that people in the North East and the South West walk more? For reasons which frankly baffle me.
👩🎓 From academia
The clever clogs at our universities have published the following excellent research. Where you are unable to access the research, email the author – they may give you a copy of the research paper for free.
Are shared automated vehicles good for public- or private-transport-oriented cities (or neither)?
TL:DR – They might not be good for cities focussed on public transport.
TL:DR – Walking to school is more important to parents than it is to kids.
TL:DR – A good sense of place could mediate the relationship between travel and student experience.
Putting Automobile Debt on the Map: Race and the Geography of Automobile Debt in California
TL:DR – Black and Latino communities have more automobile debt.
📺 On the (You)Tube
This isn’t the story of a rail route. This is the story of a country.
🖼 Graphic Design
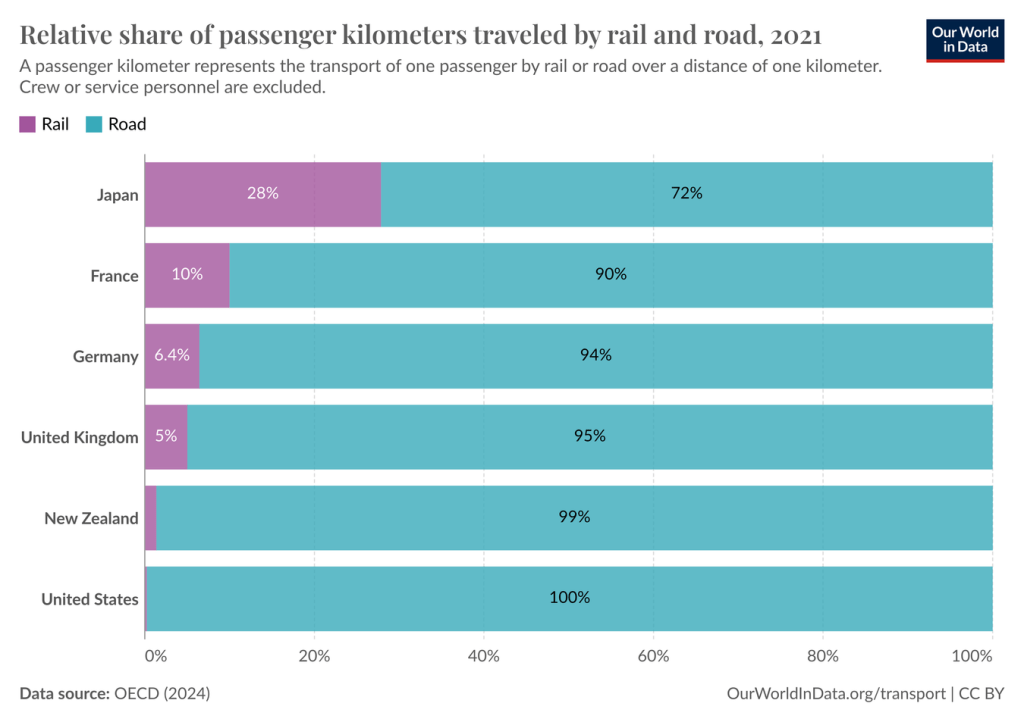
Rail travel is more prevalent in Japan than in Western Europe, and much more than in the United States (Source: Our World In Data)
The global rail utopia is not Europe. Its Japan. The data does not lie.
📷 Out and About
When out in Lewes recently, I came across a old bit of street furniture that has been mostly consigned to history. But when repurposed, they often look amazing. I am talking about the cattle trough.
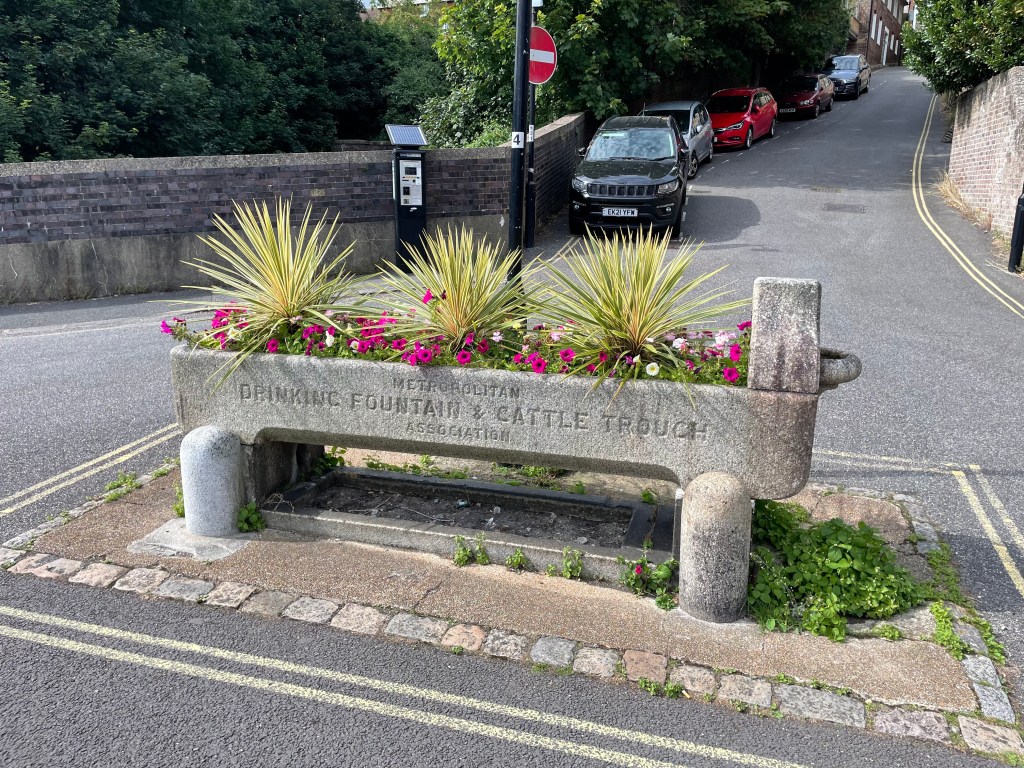
Cattle trough in Lewes
I also went out to get some seeds for a new tree I am planting in the garden. Though many of my British followers will know these seeds by another name. Lets see if they do their job!
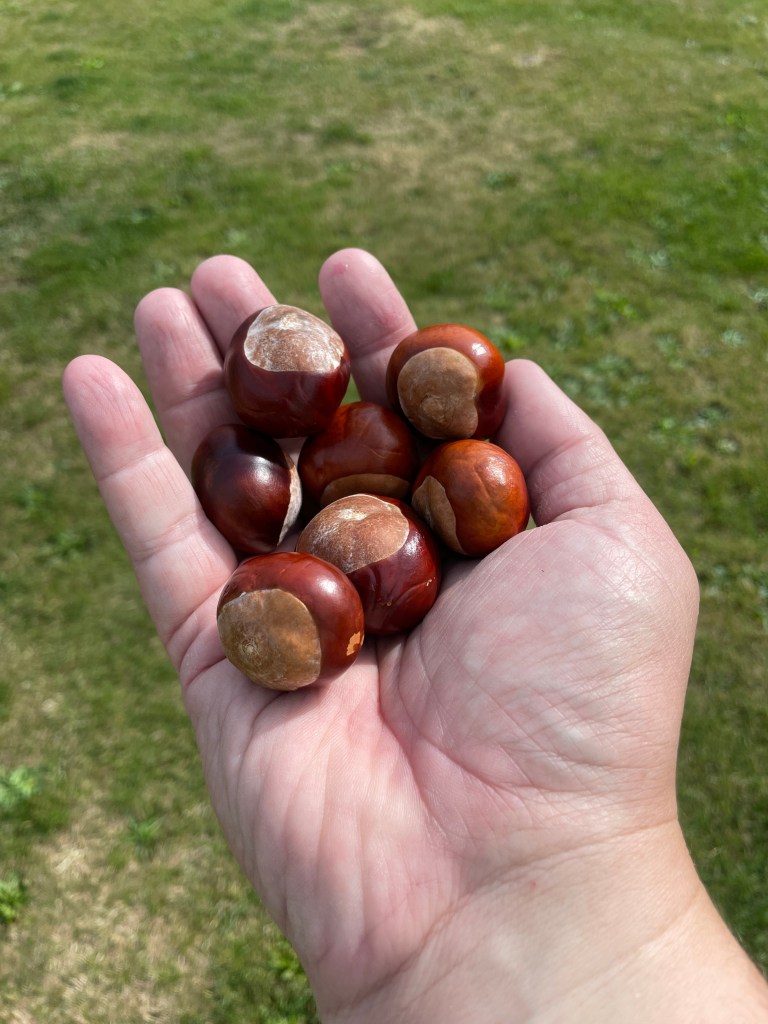
Seeds for the new tree
📚 Random Things
These links are meant to make you think about the things that affect our world in transport, and not just think about transport itself. I hope that you enjoy them.
- Local decline and populism (VoxEU)
- Weather forecasts could warn about events made worse by climate change (New Scientist)
- The forgotten fight to ban gas-powered cars in the 1960s (Grist)
- Q&A: Myth-Busting Rural Decline, with Ann Eisenberg (The Daily Yonder)
- Begun, the open source AI wars have (The Register)
📰 The bottom of the news
The annual Ig Noble Awards have been given for amusing scientific research. And there are some corkers. My personal favourite involved a cow, cat, and a paper bag.
👍 Your feedback is essential
I want to make the newsletter better. To do this, I need your feedback. Just fill in the 3 question survey form by clicking on the below button to provide me with quick feedback, that I can put into action. Thank you so much.


One response to “🛍 Mixed Bag”
A thought about the slow ‘recovery’ for those with mobility issues – I always think that word applied across all modes is inaccurate. In this instance, could the lack of ‘recovery’ not simply be due to how remote access as an option for work and services has exploded, so that those with a mobility issue can now gain access to daily needs without needing to travel? In which case the lack of ‘recovery’ may not be a bad thing, but an indicator of shifting service patterns and new benefits for a previously poorly served sector. Social isolation is another matter, but perhaps not needing to travel to work, go to the shop, go to the pharmacy would enable people more energy to go out to socialise instead.
Sarah Chapman BSc (hons), MCIHT
Associate
Markides Associates Transport Planning and Engineering
Markides Associates Ltd.
81 Southwark Bridge Road, London, SE1 0NQ
Reception: 020 7442 2225 | Direct Dial: 020 7048 1207
Registered in England and Wales No. 10394301
This e-mail and any attachments are confidential and may contain information that is privileged. If you are not the named recipient, or responsible for delivering the message to the named recipient, you must not disclose, distribute, forward, copy, store or use this e-mail or its attachments in any form. If you have received this communication in error, please accept our apologies and promptly inform the sender by e-mail or by telephoning the above number. Please also immediately delete this message and any attachments from your systems. Thank you.
LikeLike