Good day my good friend.
As you get older, one of life’s underrated skills that you get to perfect is the simple art of doing nothing. Apparently it has a term associated with it, and what I don’t mean here is literally doing nothing. But this is the art of sitting back, and just observing life go by. Or maybe just reading a book in your living room. It doesn’t require plans, meet ups, or extensive research. It is just the art of doing very little.
I admit that I quite like this way of life. I love going out with friends and doing things. But I am also very happy reading a book, or sat in my garden watching the world go by. The transport impacts of “doing nothing” have yet to be researched.
If you like this newsletter, please share it with someone else who you think will love it. The main way my audience grows is through your recommendations. I will love you forever if you do. 😍
🤦♂️ Brexit Bonus
Ahh, the B-word. The thing that seemed to break all manner of political discourse in the UK, as well as being the current Conservative Party’s only meaningful achievement over the last 14 years (and calling it an achievement is beyond a stretch). And something that has been a big talking point in a major, and often-overlooked – part of transport planning, namely freight.
The UK is a net-importing country. And much like other countries, the majority of the goods that are imported come through a handful of ports. Despite what media may have you believe, Dover is not the UK’s busiest port by freight tonnage. In fact, no fewer than 9 ports in the UK handled more freight than Dover did in 2022 (18.369 million tonnes of freight):
- Port of London (54 million tonnes)
- Grimsby and Immingham (50 million tonnes)
- Milford Haven (39 million tonnes)
- Liverpool (33 million tonnes)
- Southampton (31 million tonnes)
- Tees and Hartlepool (25 million tonnes)
- Felixstowe (22 million tonnes)
- The Firth of Forth (20 million tonnes)
- Belfast (18.372 million tonnes)
This is slightly disingenuous to Dover, to be fair. Dover specialises in one type of freight: roll-on, roll-off. As the name implies, this consists of trucks rolling onto ferries and rolling off them. Excellent for things on a tight schedule that need to minimise transfer times. Whereas most of the other ports handle a variety of types of freight traffic, as the below statistics show.

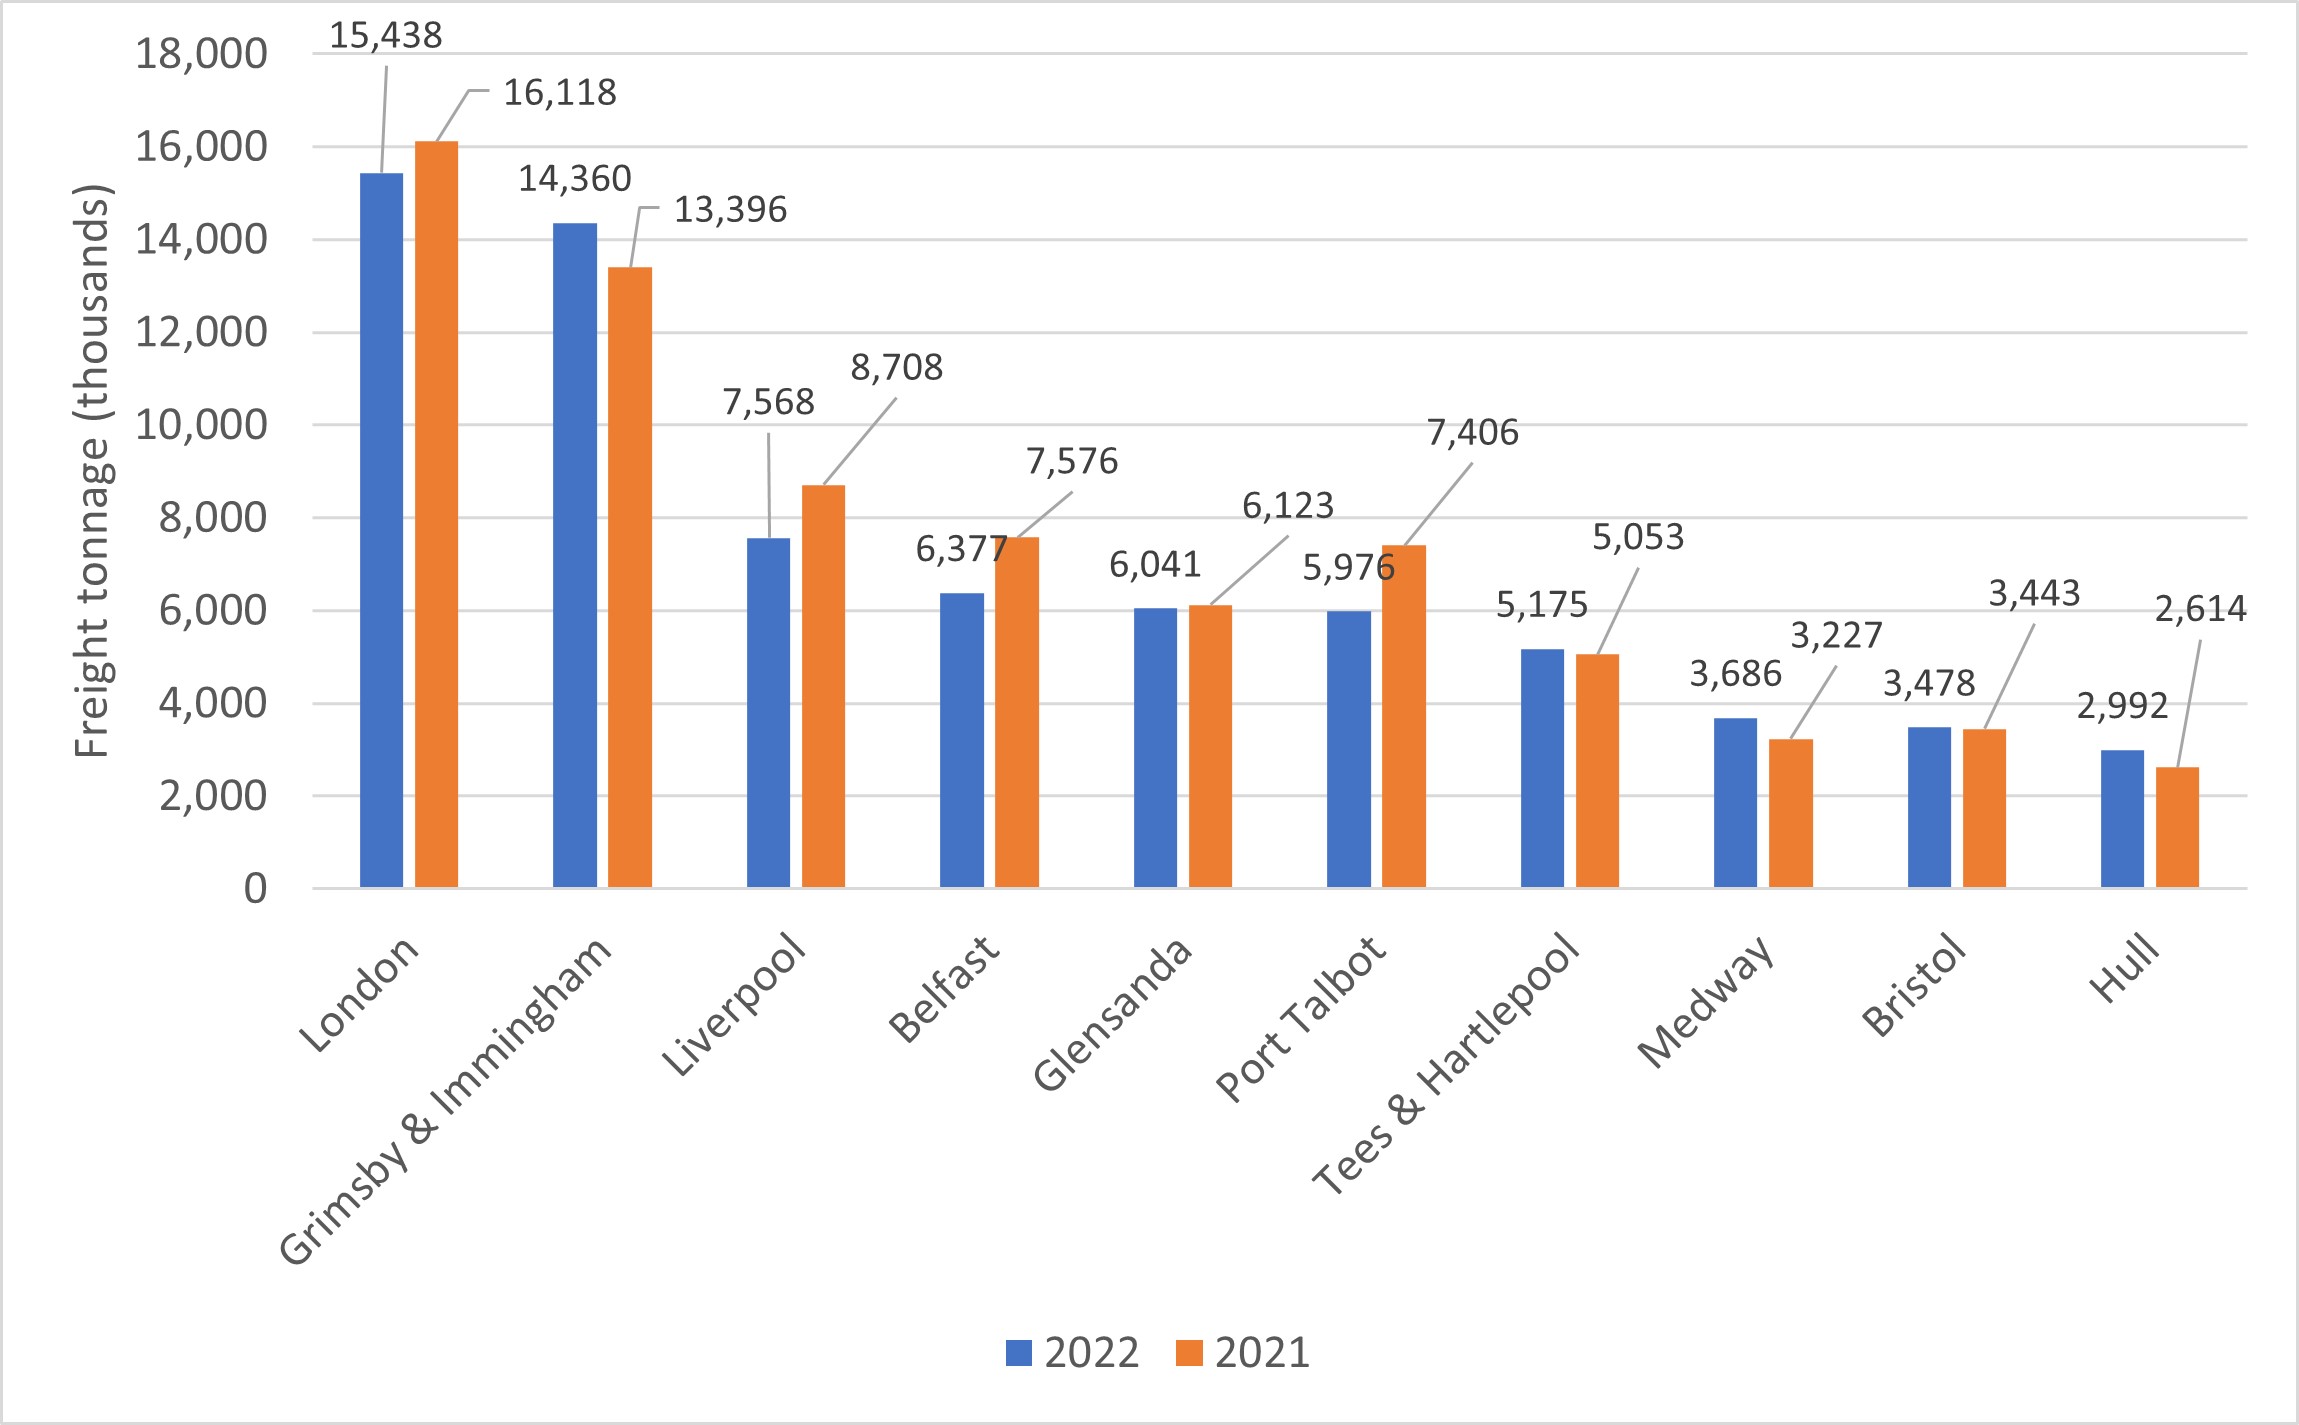
Freight through the top 10 UK ports by freight tonnage – Roll-on, Roll-off (Source: Department for Transport)
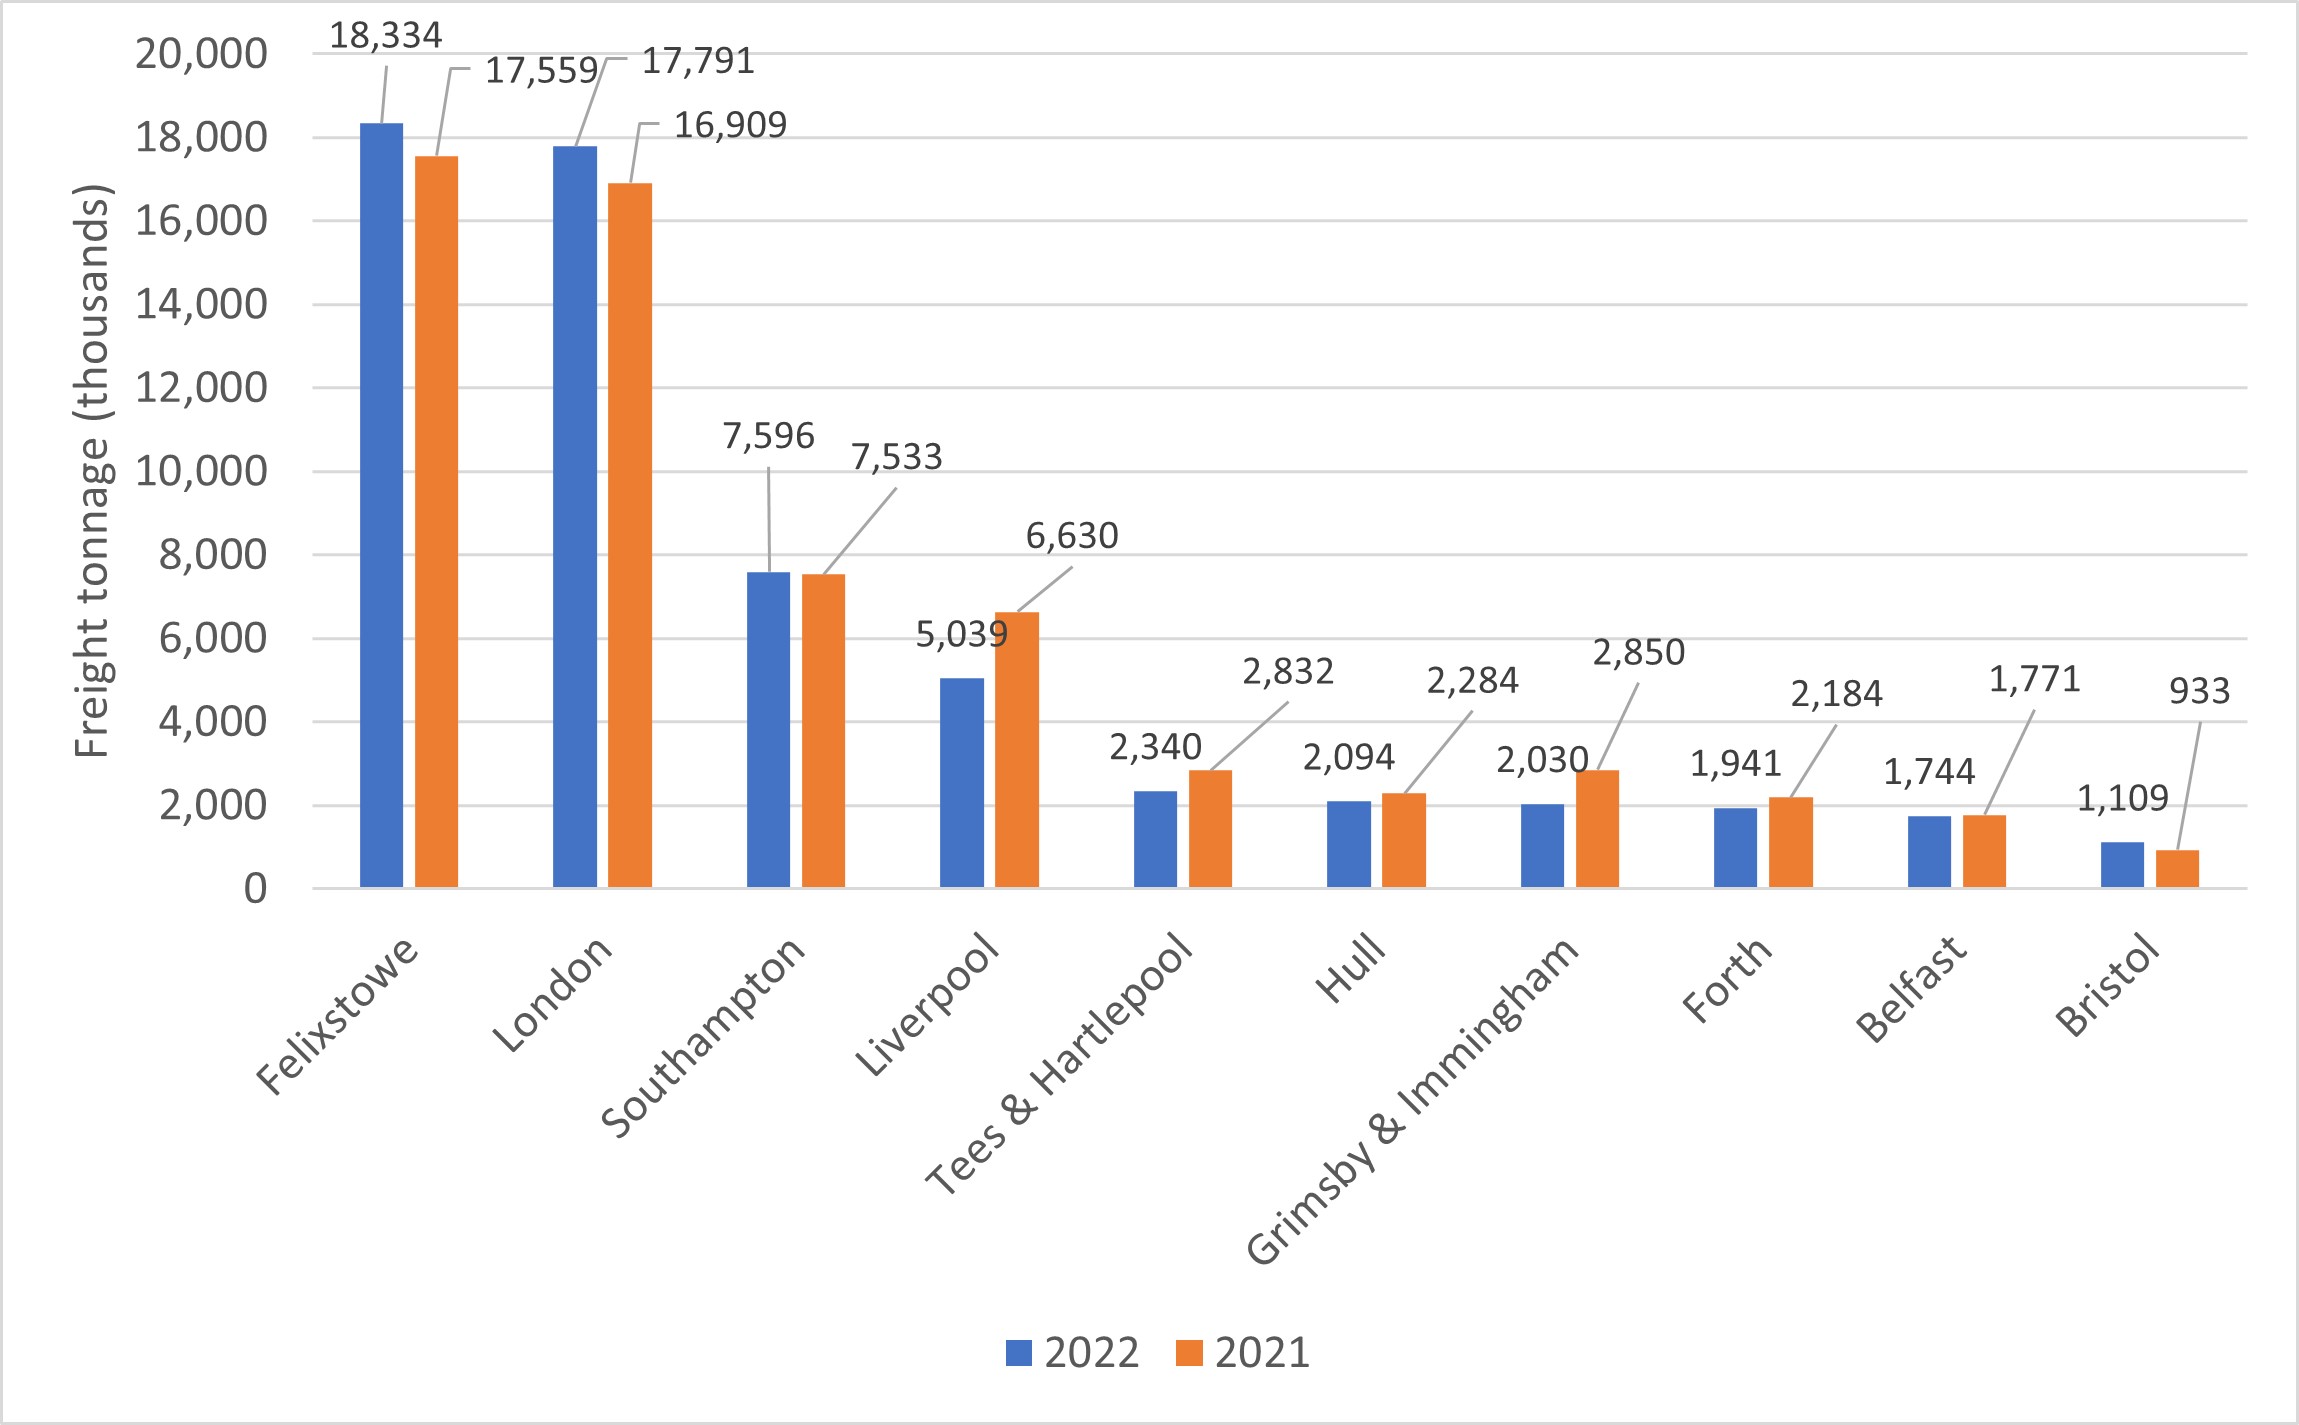
Freight through the top 10 UK ports by freight tonnage – Load-on, Load-off (i.e. containers) (Source: Department for Transport)
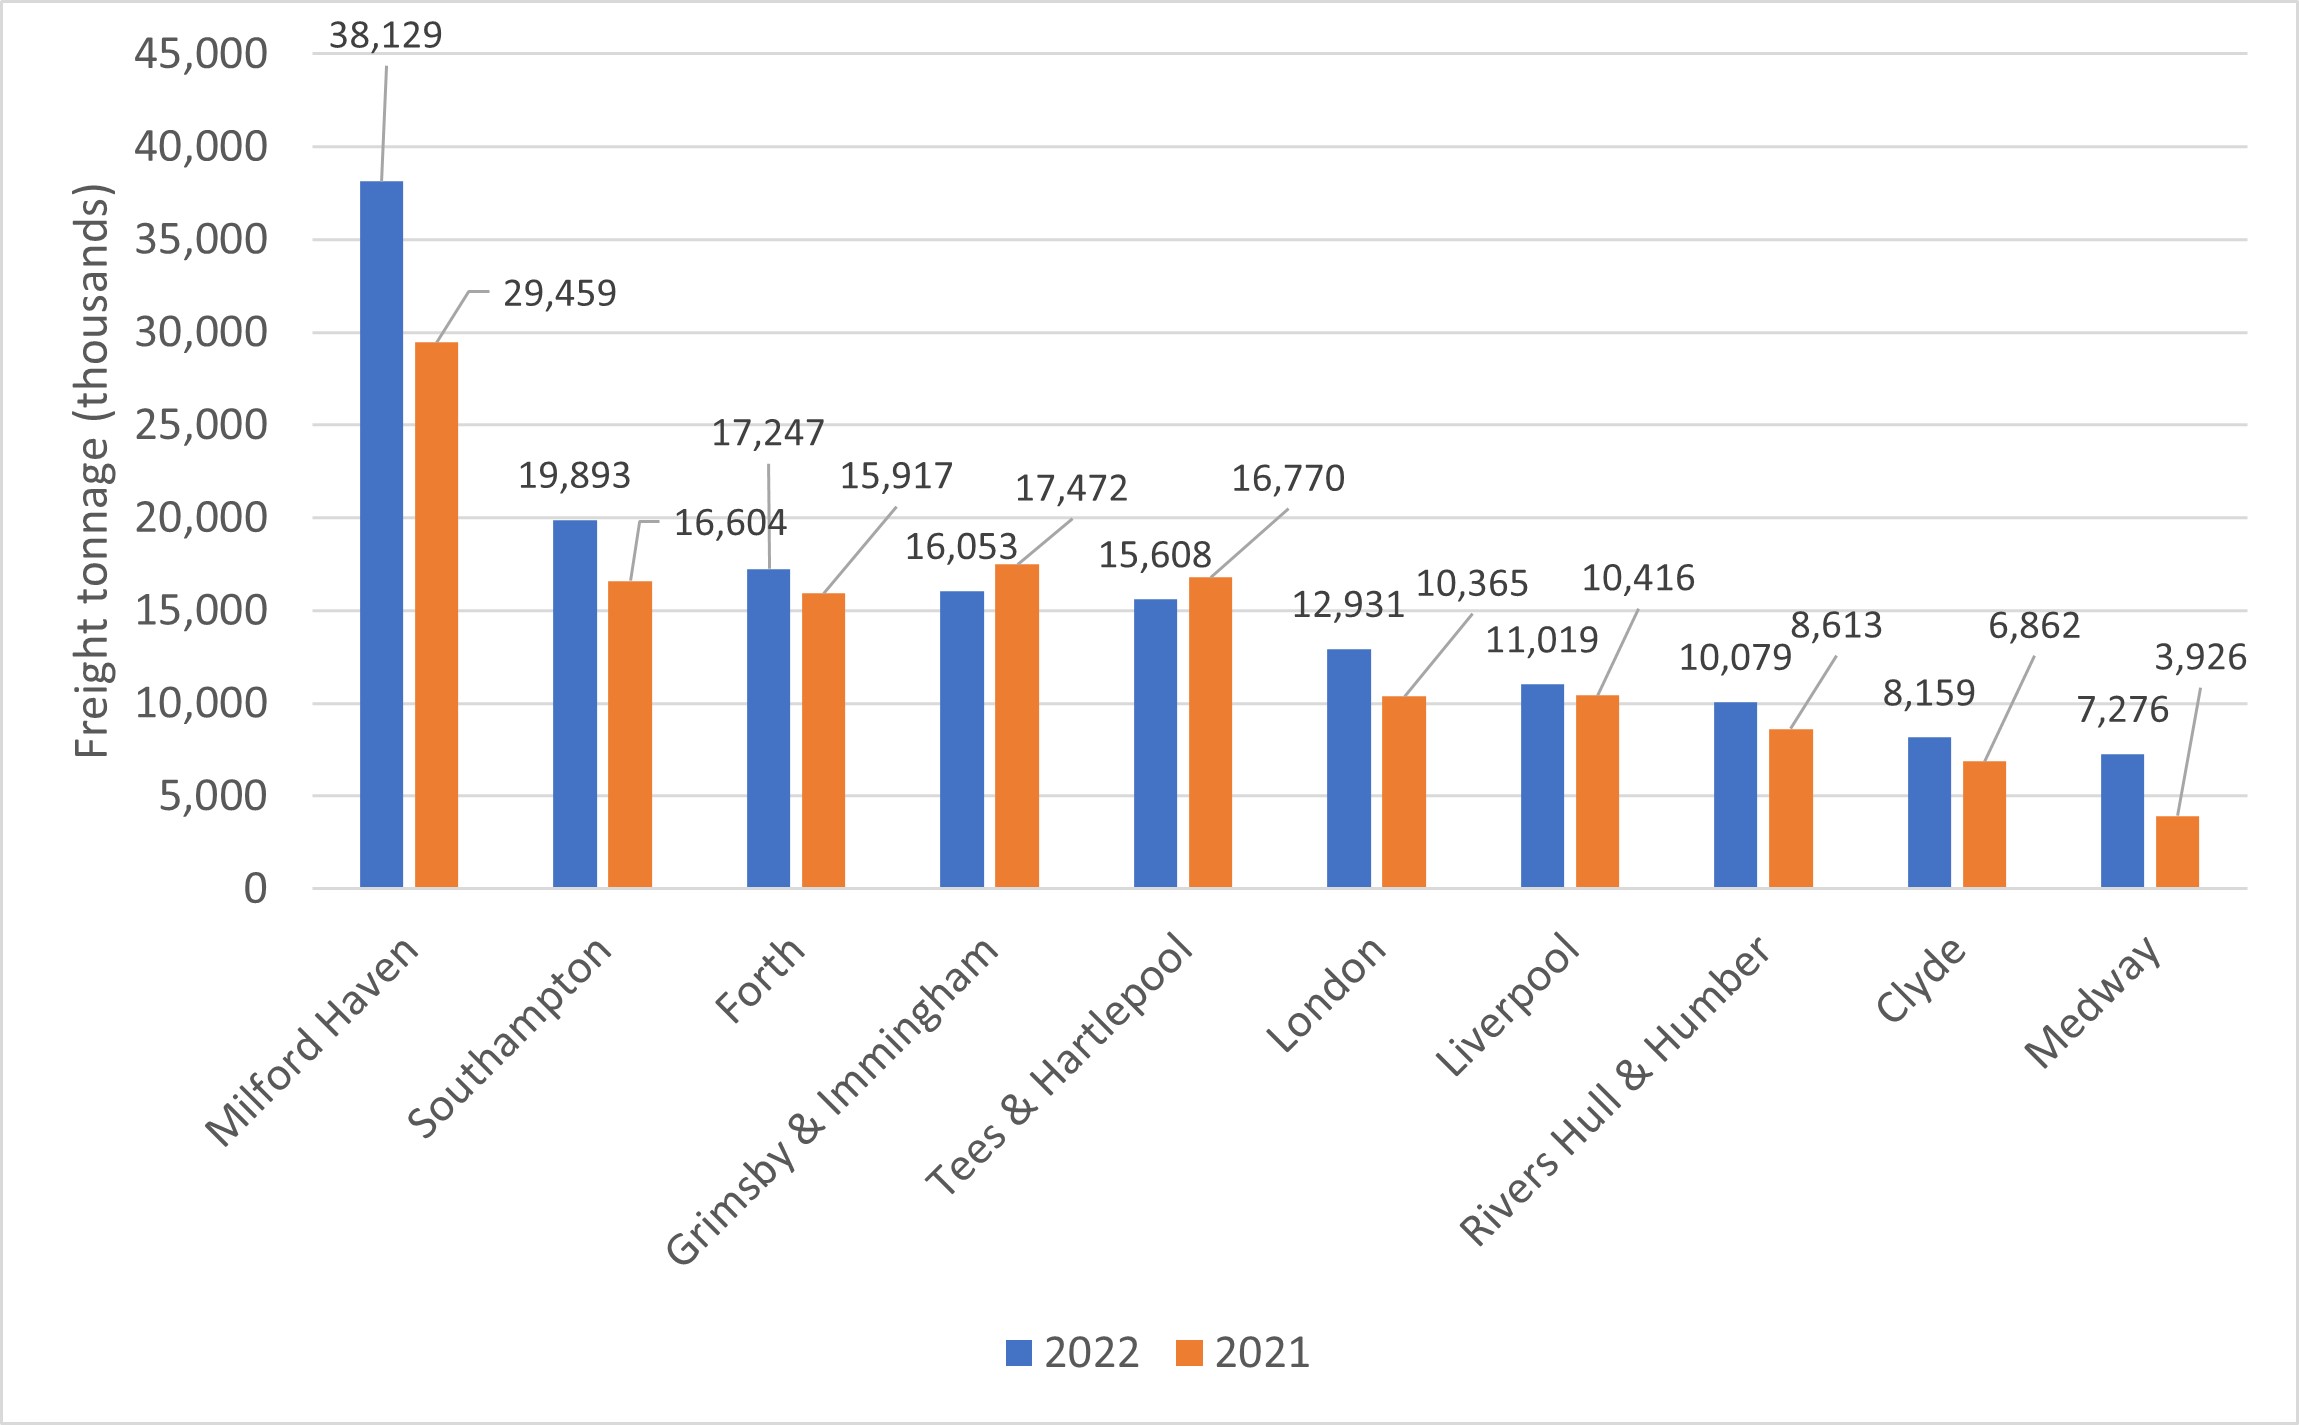
Freight through the top 10 UK ports by freight tonnage – Liquid Bulk (Source: Department for Transport)
Freight through the top 10 UK ports by freight tonnage – Dry Bulk (Source: Department for Transport)

Freight through the top 10 UK ports by freight tonnage – Other General (Source: Department for Transport)
When you start looking through the data on freight coming through UK ports, what becomes immediately clear is how, so far, the impact of Brexit is less than another major economic shock of the last 20 years: the 2008 Financial Crash and consequent recession. In fact, total freight traffic through UK ports has still not got back to 2008 levels.
Between 2008 and 2009, the amount of freight going through UK ports dropped by 10% (around 61 million tonnes), whereas it dropped by 9% (around 43 million tonnes) in 2020 when Brexit was ‘done’ but also something else happened that may have impacted global trade 🙄.
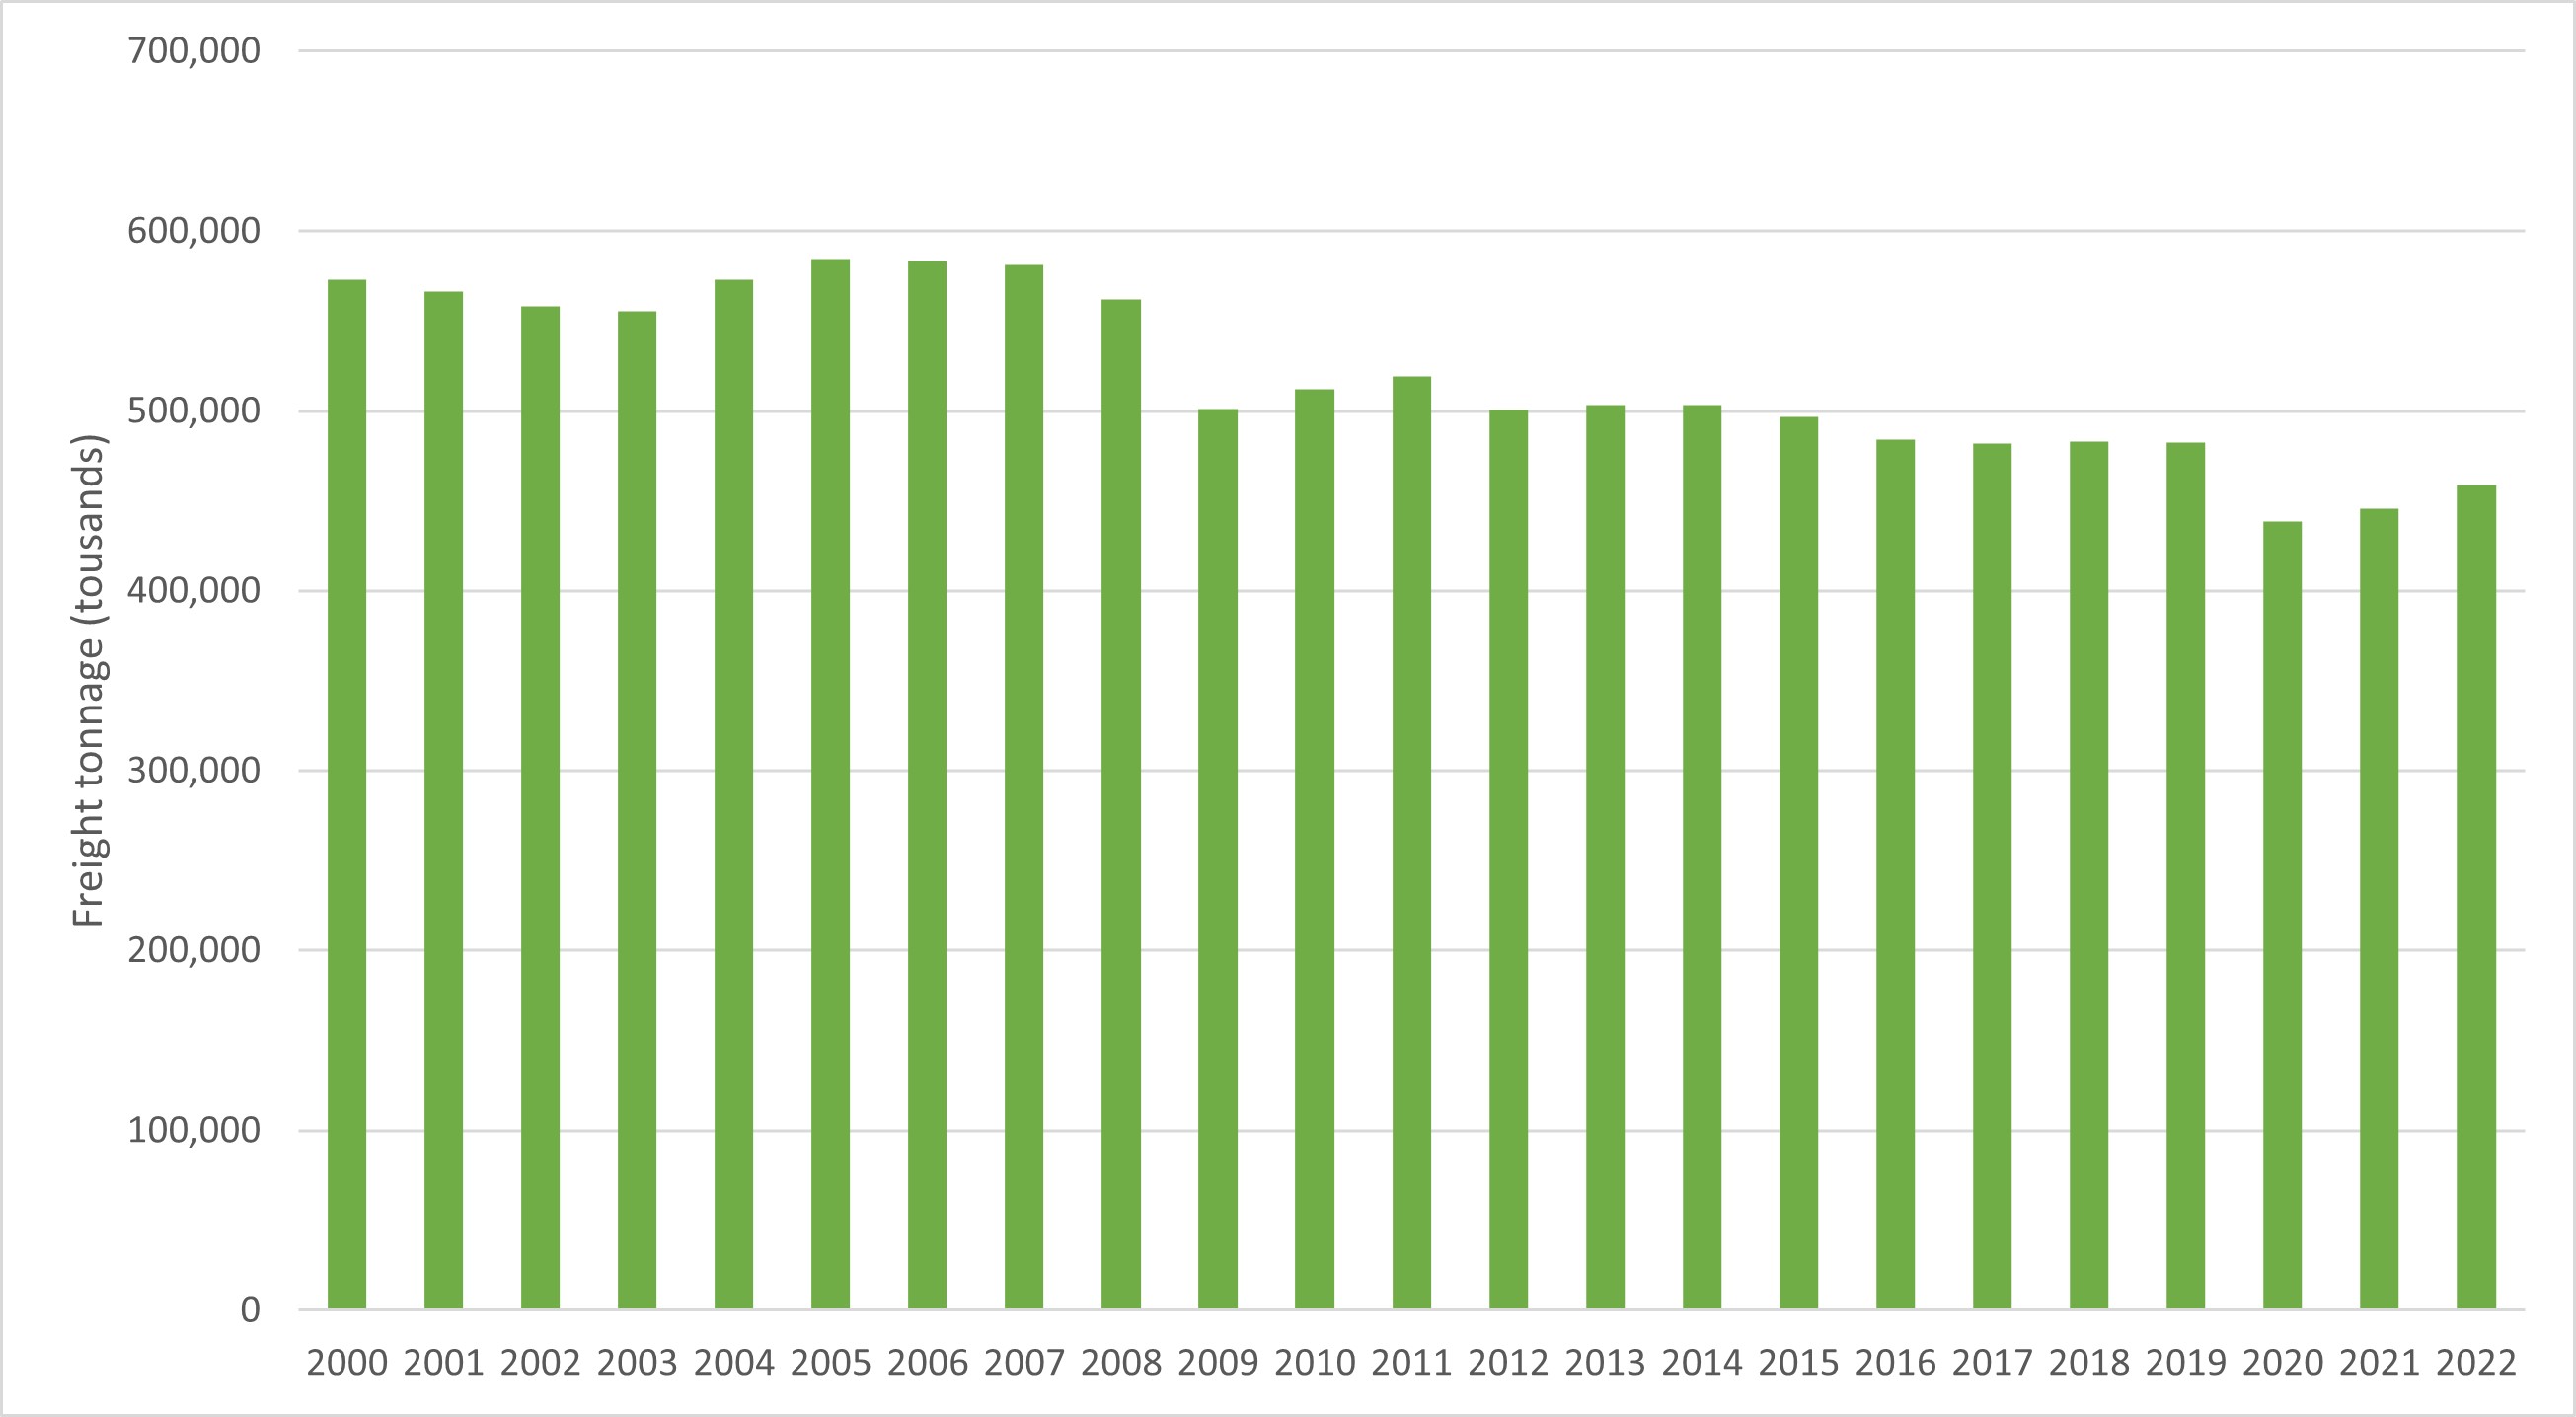
Freight through all UK ports by tonnage (Source: Department for Transport)
To continue the observation by port, Dover has seen the biggest decrease in freight tonnage of the top 10 ports in the UK both in terms of percentage and total numbers. But the picture is far from consistent. Whilst most ports saw a decline in freight, there were notable exceptions in the Port of London, Milford Haven, and Liverpool.
Changes in freight tonnage through the top 10 UK ports between 2018 and 2022 (Source: Department for Transport)
| Port | Freight tonnage in 2018 (000 tonnes) | Freight tonnage in 2022 (000 tonnes) | Percentage change |
| Port of London | 53,196 | 54,880 | +3.2% |
| Grimsby and Immingham | 55,617 | 50,166 | -9.8% |
| Milford Haven | 30,935 | 38,902 | +25.8% |
| Liverpool | 32,613 | 33,622 | +3.1% |
| Southampton | 34,468 | 31,278 | -9.3% |
| Tees and Hartlepool | 28,836 | 25,378 | -12% |
| Felixstowe | 28,268 | 22,197 | -21.5% |
| The Firth of Forth | 26,587 | 20,529 | -22.8% |
| Belfast | 18,939 | 18,372 | -3% |
| Dover | 24,943 | 18,369 | -26.4% |
To complete the picture, analysing the changes by type of freight shows that there has been a drop in tonnage across all types of freight. Liquid Bulk (gas, oil etc.) and Dry Bulk (ores and agricultural produce) saw slighy declines of 1% and 2% between 2018 and 2022. The biggest drops were in containers (10%), roll-on roll-off (8%), and other general cargo (14%).
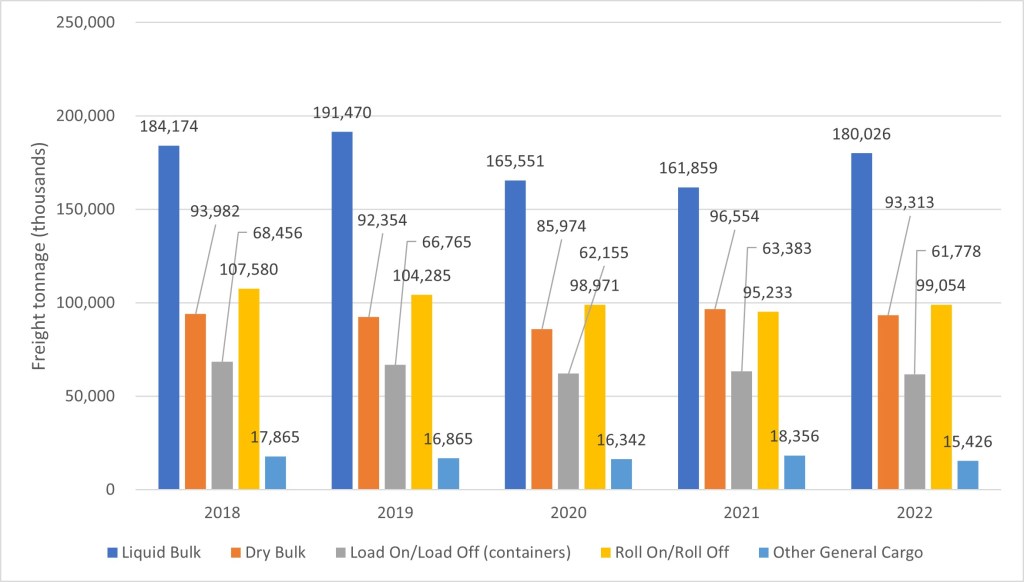
Freight through Major ports by tonnage and type of freight (Source: Department for Transport)
So what can we conclude from this data? For me, not a lot, and there are two reasons for this. Firstly, it is impossible from this data to disentangle the effects of Brexit from COVID-19 and the impacts that had on the global economy and supply chains. While it may be possible to conclude that drops in traffic at Dover may be partly due to Brexit, that does not explain similar drops at Felixstowe or the Firth of Forth, or why the Port of London bucks the trend.
Secondly, the very worst implications of Brexit for ports have yet to be realised. Later this year, new border checks are expected to be installed for people entering the European Union. Meanwhile, checks on food and animal produce will shortly be introduced after being delayed 5 times.
The reality is likely that the changes noticed at UK ports reflect wider changes in the UK, European, and World economies, of which Brexit is a part of. Supply chains have shifted, the world economic ‘centre’ is moving further East, and the entire world is experiencing problems in productivity and economic growth. While Brexit likely plays a role in the reduction in trade through UK ports, be careful of using it as an easy go-to excuse. As with many things, the reality is much more complex, and much more interesting, than you may think.
👩🎓 From academia
The clever clogs at our universities have published the following excellent research. Where you are unable to access the research, email the author – they may give you a copy of the research paper for free.
Willingness to pay extra for electric cars with sustainably produced batteries
TL:DR – 32% of people will pay for for sustainably produced batteries.
TL:DR – Invest in active travel and you get more people walking, cycling, and its great for health too.
Analysis of controversial driving licensing policies in Iran: Experts’ viewpoints
TL:DR – If you want a different perspective on things you should read this, but you may not like it…
The transport problem: The need for consistent policies on pricing and investment
TL:DR – We really should think of pricing when making investment decisions, especially for roads.
✊ Awesome people doing awesome things
Whenever you make a transport infrastructure improvement, always look for ways to improve other things at exactly the same time. This is what is happening in Bolton, where as part of improvements to local buses, pedestrian crossings are being upgraded to the tune of £700,000. After all, its no good having better buses when people struggle to get to them.
📺 On the (You)Tube
If you have seen any sort of meme online on Roman Roads, chances are its false. As ably explained by Paul Whitewick.
🖼 Graphic Design
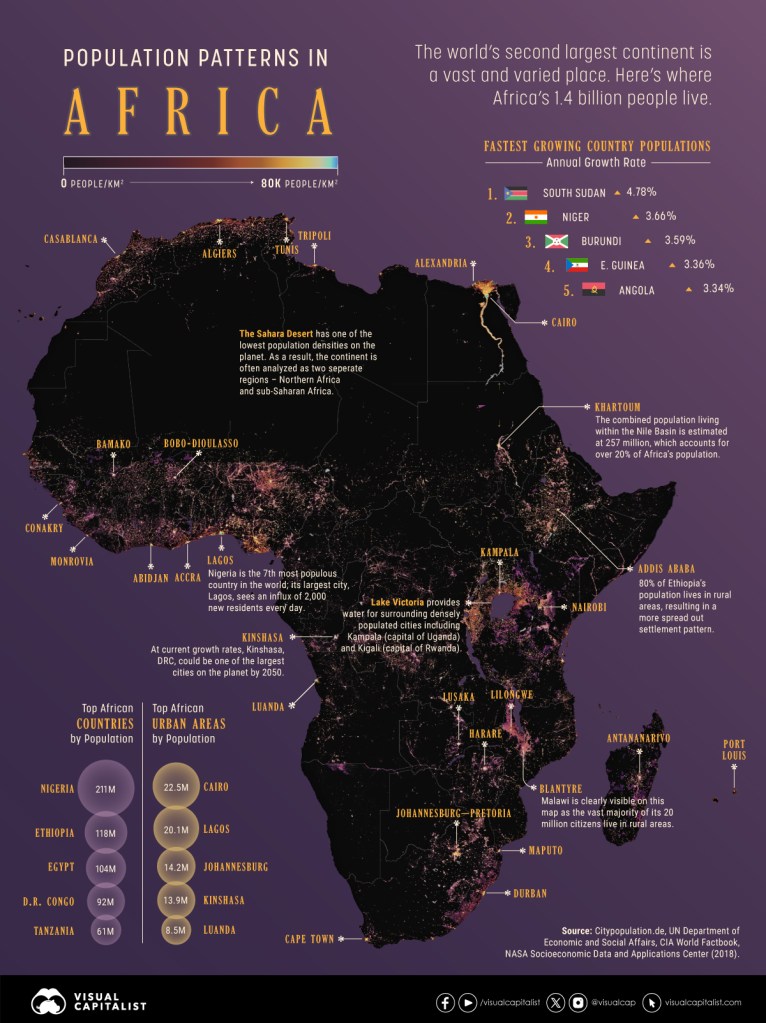
I love a population density map. And no prizes for guessing where the rivers and lakes are in Africa.
📚 Random things
These links are meant to make you think about the things that affect our world in transport, and not just think about transport itself. I hope that you enjoy them.
- What Your Brain Is Doing When You’re Not Doing Anything (Quanta)
- DINKs, Couples With No Kids, Are Living the New American Dream (Business Insider)
- Pipeline network crucial to Europe’s bold 2030 hydrogen plans (S&P Global)
- Economic Solutions: How To Go from Financialized Neoliberalism to a Productive, Sustainable Economy (Naked Capitalism)
- Everyone’s a sellout now (Vox)
📰 The bottom of the news
This is not to do with transport that much, but the story of an American radio station having its 200 feet radio tower stolen has me asking all sorts of questions. Like “why,” “how,” and “the hell?!?!?”
👍 Your feedback is essential
I want to make the calls to actions better. To do this, I need your feedback. Just fill in the 3 question survey form by clicking on the below button to provide me with quick feedback, that I can put into action. Thank you so much.