Good day my good friend.
Not much for me to say today. Which is no bad thing for you. Let’s get to it.
If you have any suggestions for interesting news items or bits of research to include in this newsletter, you can email me.
James
The Most Important Graph in Transport Planning
Is this one.
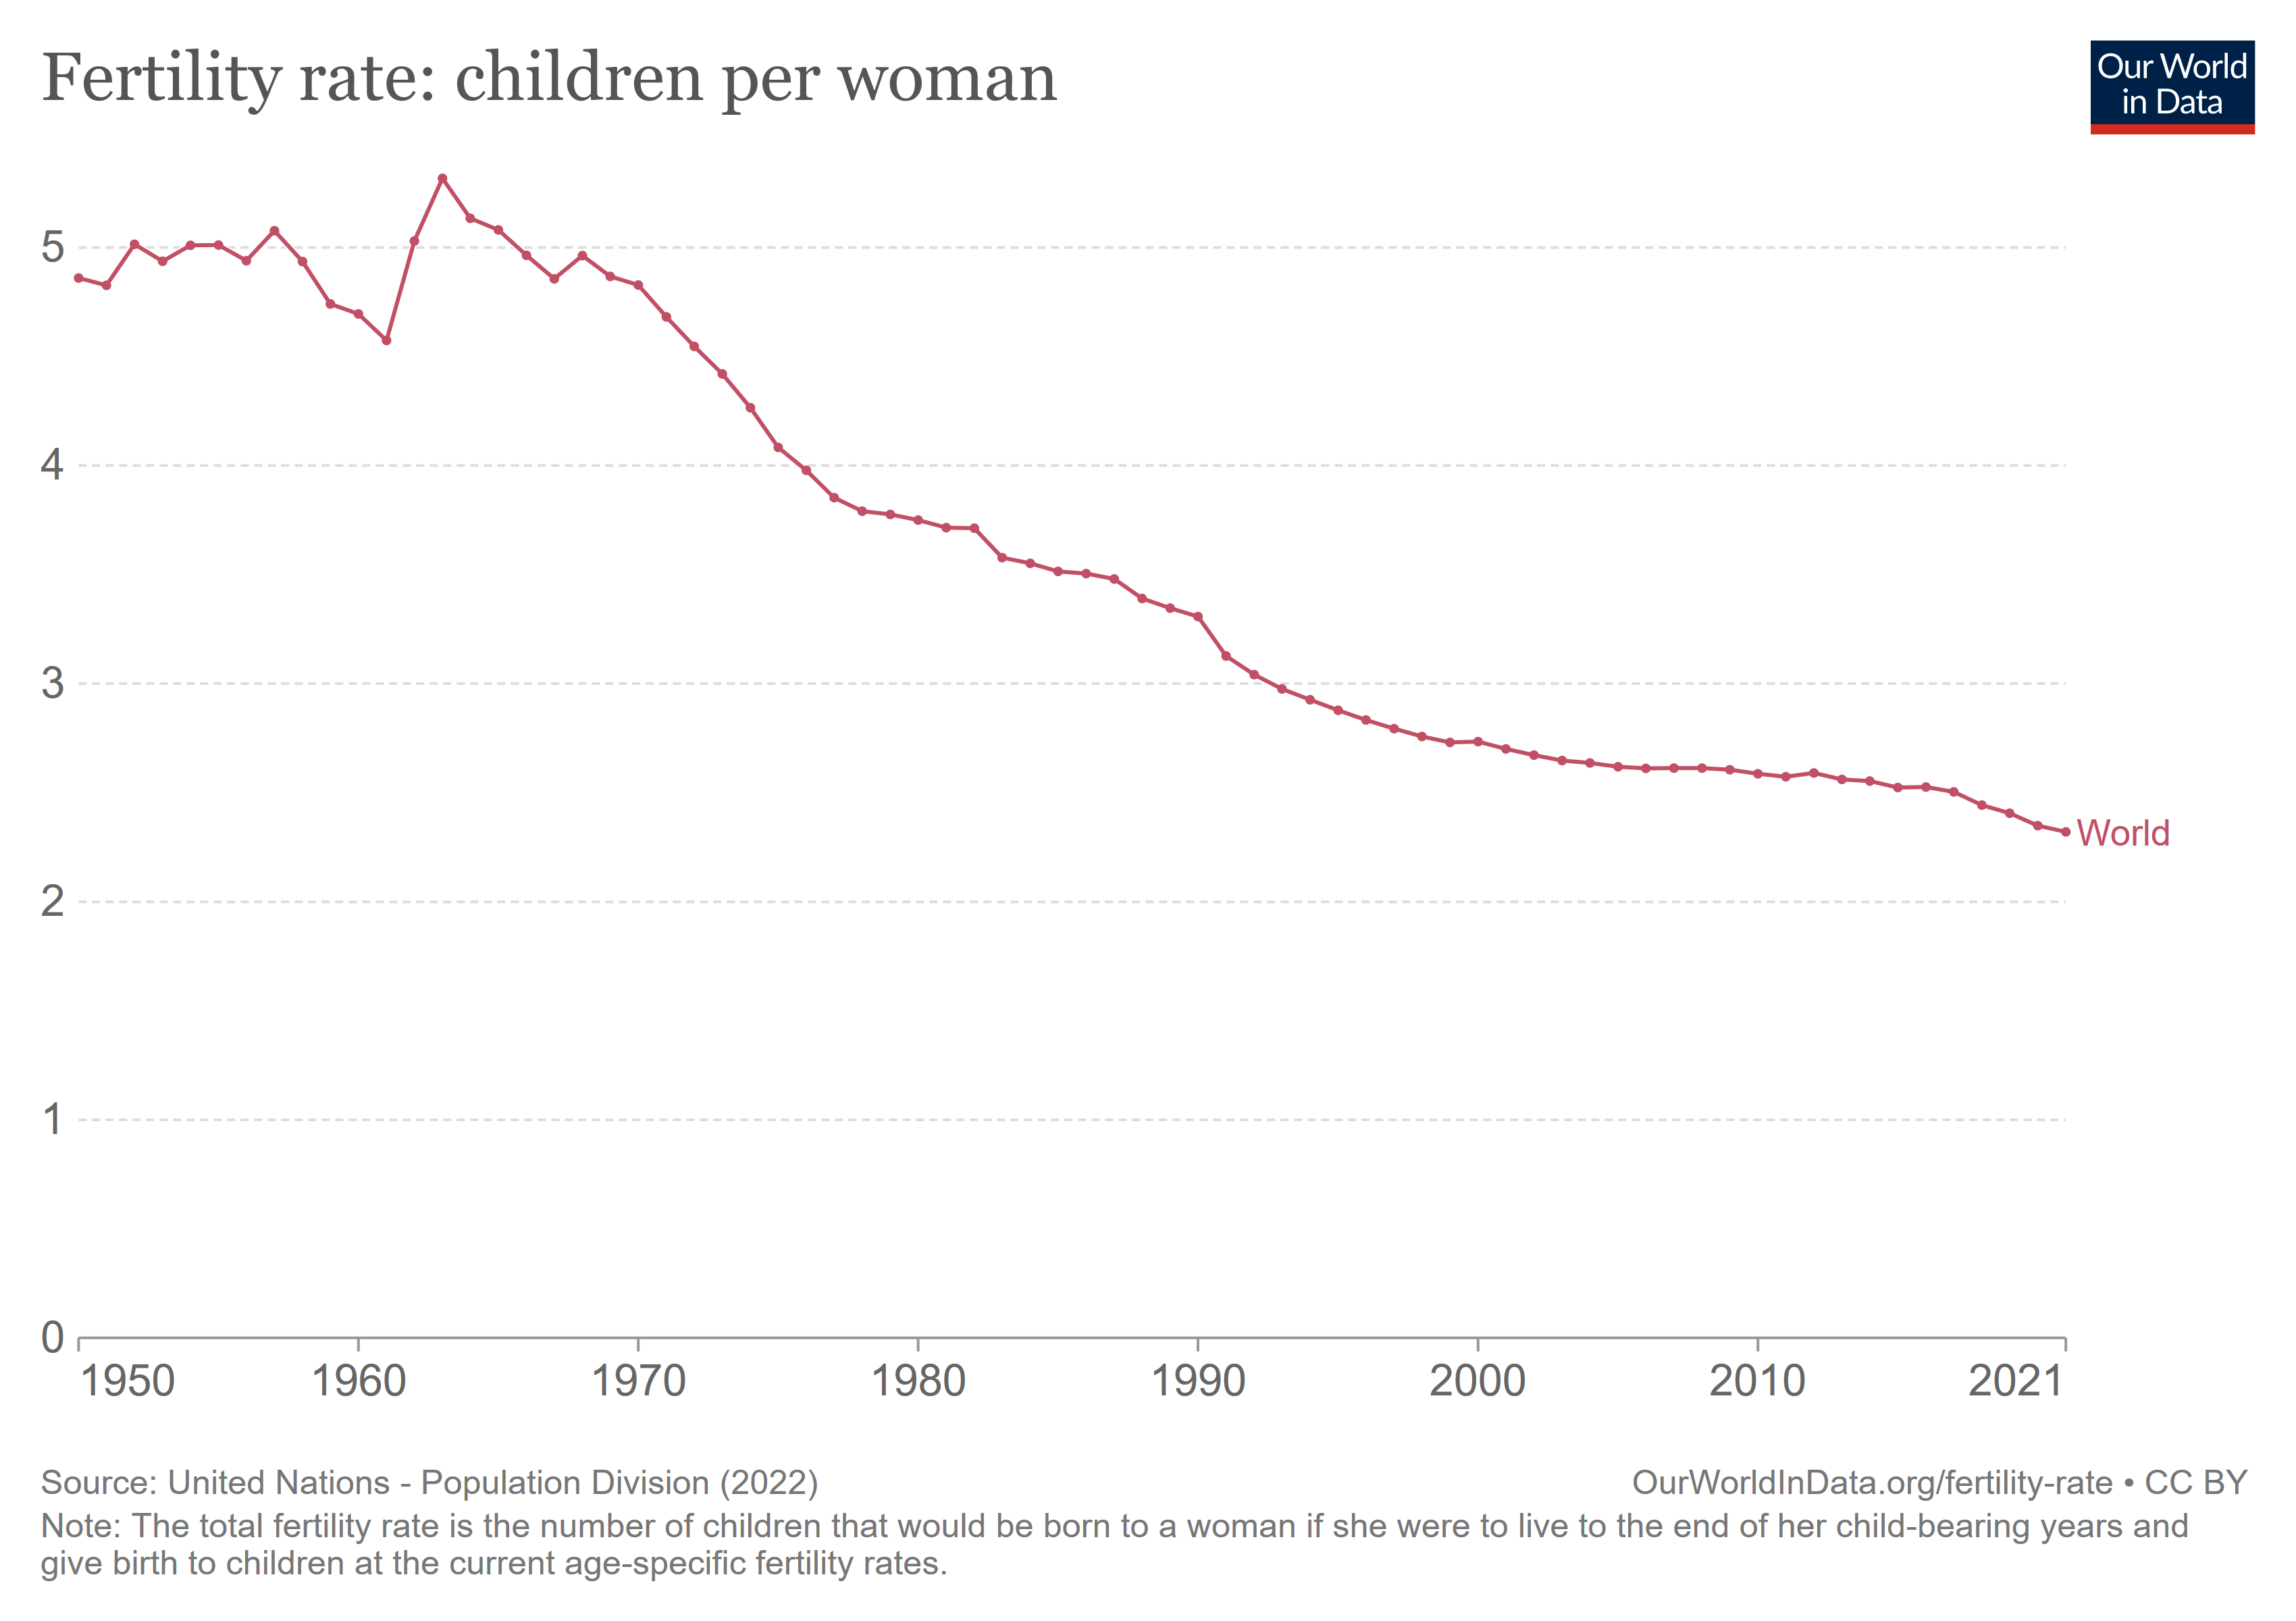
Its nothing to do with changes in car ownership or use of public transport. Its to do with how many people there will be on this Earth in the future. The fertility rate essentially estimates the ‘replacement’ of people when they die. The replacement rate (the rate at which each person who dies is replaced) is 2.1 children per woman. It is currently at 2.4 per woman globally, and is dropping.
This dropping fertility rate is why the UN estimates that the global population will top out at 10 billion in 2080 even if nothing else is done. Considering population estimates are pretty accurate, we have reason to believe this. What’s more, many countries are already seeing declining populations to the point whereby they consider them to be a national emergency. See Japan, South Korea, and Russia as perfect examples of this.
Why is this important to transport? Firstly, growth in travel is closely linked to population growth. In estimating future demand, immigration is now taking on a greater importance in the forecasts. And if the case is being made in favour of a specific mode, modal shift as a way of growing that demand will become more important to estimating demand, as opposed to new trips generated.
Then there is the inevitable consequence of a lower fertility rate. We need to plan transport networks around an older population. That means Age Friendly Cities, focussing transport innovations on the needs of elderly people, and designing our transport system for old age. The need to shift away from the needs of the white, middle-aged guy is more important than ever.
The Versemont may be coming to the UK
On a day where the UK Department for Transport announced that it was in the mood for cutting schemes, one idea that is doing the rounds in Great Minster House is exploring other ways to finance transport schemes. The Workplace Parking Levy and Road User Charging are already on the statute books, as well as the requirement to re-invest ‘profits’ from parking. But a new approach will be trialled in Cambridgeshire that is getting the interest of DfT – a mayoral precept ringfenced for buses.
It is estimated that this will raise £3.6 million for supporting services in 2023/24 at a cost of £12 per household. While raising Council Tax in a time of a cost of living crisis is…challenging, it shows a willingness for Councils to become more interventionist to improve services. For a long time, transport planners have urged the use of a Versemont-style tax (now the Versement mobilité) to fund services. Now, it is happening out of necessity within the current rules.

The locker room
There has been a lot of buzz in transport policy circles in recent years about parcel lockers, and their potential role as part consolidation hubs and being used to reduce freight deliveries. This has been based off previous research into the impact of consolidation centres for urban freight, which are good for reducing the amount of vehicles on the road. Parcel lockers are also often cited as being a key part of mobility hubs.
But what is their actual impact on trips? Now, we have a study that looked at that, and if you want to reduce parcel deliveries, the results are good. Using a residential complex as a proxy, delays were cut, and dwell time at the curb was cut by a third. That’s very promising indeed. And something worthy of further study.
Random things
These links are meant to make you think about the things that affect our world in transport, and not just think about transport itself. I hope that you enjoy them.
China and climate change (South China Morning Post)
Collapse and Recovery: How the COVID-19 Pandemic Eroded Human Capital and What to Do about It (World Bank)
UN forges historic deal to protect ocean life: what researchers think (Nature)
Political Risks for Railroads (Rational Walk)
Graph of the Week
The one at the top of this newsletter, obviously. But here is another one of interest. Again from Our World In Data.
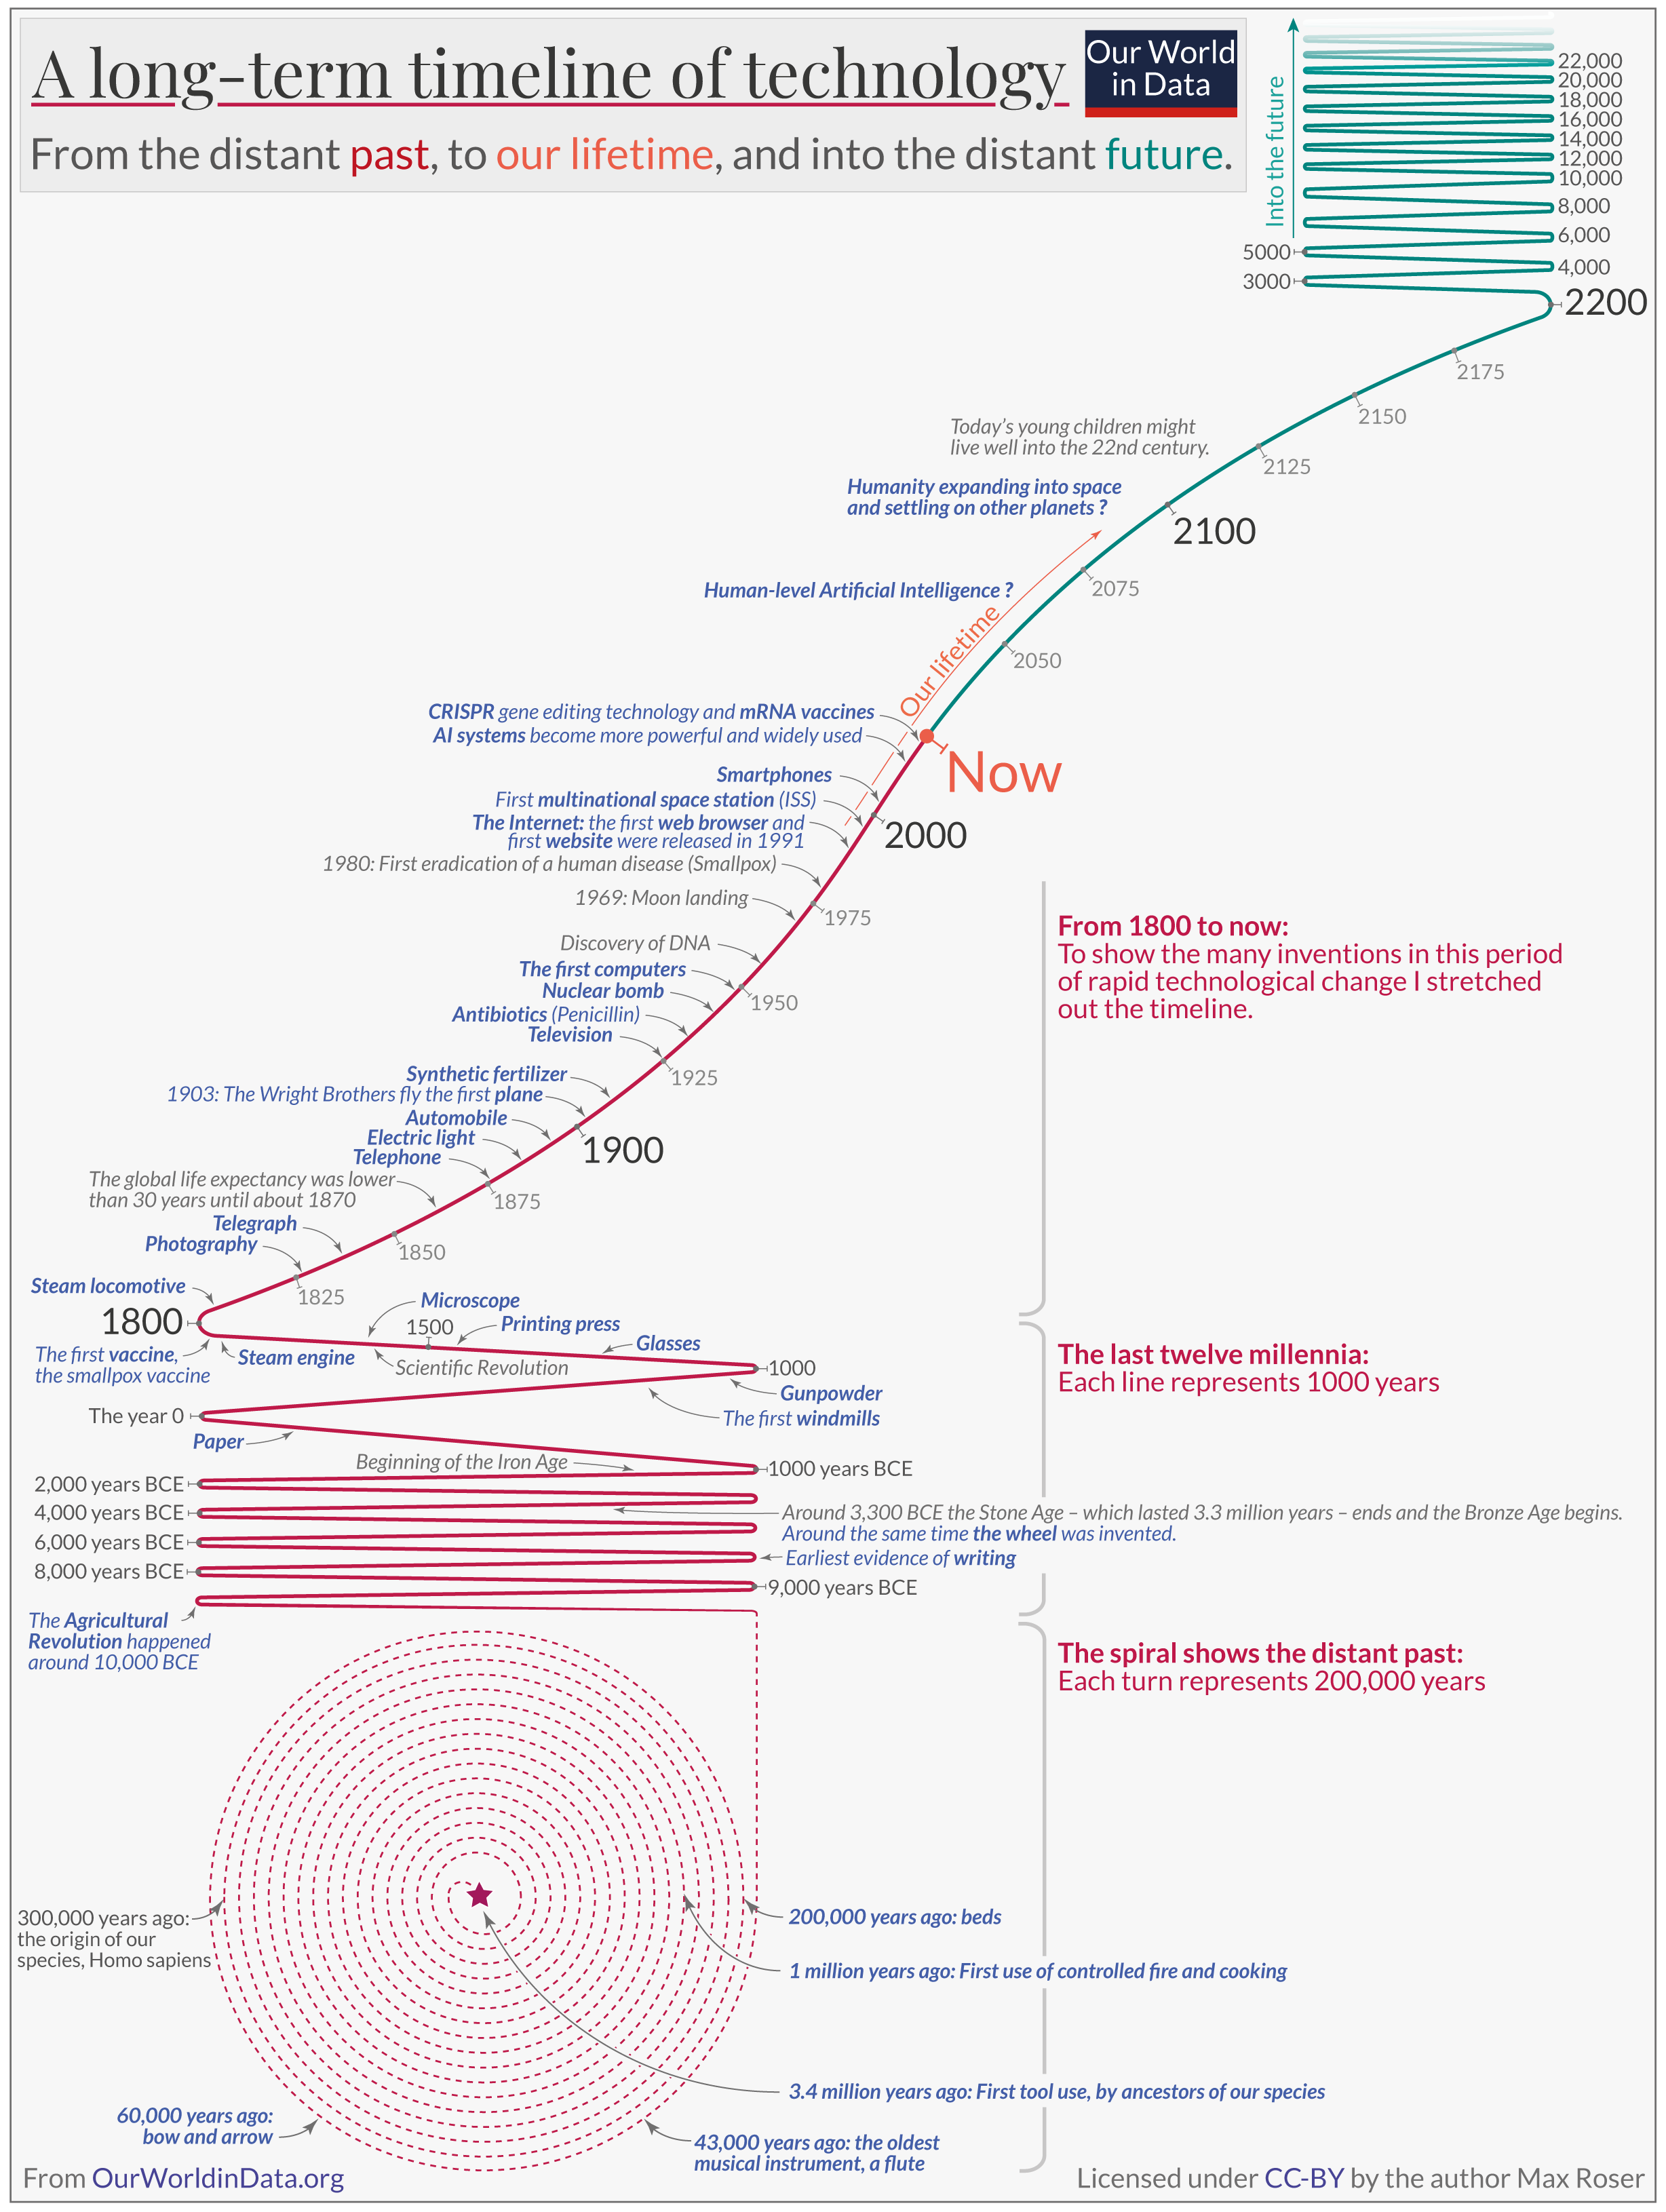
This shows the speed of the technological change of the last 100 years or so. This time 100 years ago, the television had just been invented. It had been barely 20 years since the Wright Brothers’ flight, and antibiotics had not been discovered. That’s an insane level of change.
Something interesting
This video on the growth of SUVs is both informative and depressing.
If you do nothing else today, then do this
Read this paper, mentioned in a presentation by Jillian Anable, on the discourses of climate delay. Essential reading if you want to do something about climate change.