This is a special version of Mobility Matters Daily shared exclusively with paid subscribers every Friday. You can also view the free version of the regular Mobility Matters Daily sent out to free subscribers.
Good day my good friend.
The difference in leadership is striking. One quits because they cannot give it their all. One apologises for not adhering to basic road safety, and defends taking internal flights within the UK on routes that are easily travelled by train because they are busy. Sorry to be political, but the difference is night and day. And some wonder why people don’t like politicians.
If you have any suggestions for interesting news items or bits of research to include in this newsletter, you can email me.
James
Data isn’t the challenge, the process is
Transport is a funny thing. We are always in the process of wanting more data, and different ways to analyse it. Ask any transport planner and ‘better data’ is a demand you will often hear. But very often, better data is not what is needed. What is needed is the ability to translate that data and insight into actionable policy.
There are well-established frameworks for undertaking effective Monitoring and Evaluation of schemes. Yet, even as recent meta-analyses of scheme impacts has shown, there is a significant variability in the quality of the analysis that is undertaken. This is not an issue of data collection, but one of process. There are great plans to monitor, but no logic underpinning them where the impacts of an intervention are clear.
We constantly create tools, and there are some amazing tools out there. A special mention to QGIS and MatSIM here. But more work needs doing on embedding monitoring, evaluation, and data and making it useful. In the UK, there is only one organisation who has even come close to understanding this. National Highway’s Data Strategy is brilliant. Not because it says “we need more data” but it says “we need to use data better and give people the capability to do it.”
Over the last 18 months, I have worked with Hertfordshire County Council a lot on data collection to support scheme delivery. Not on actually collecting the data, but spending time to set up templates and processes for making the data useful. It has given me inspiration for work for my own business, and where its new focus could be. In the meantime, use tools and new data sources if you like. But first, think about making them useful.

Graph of the Week
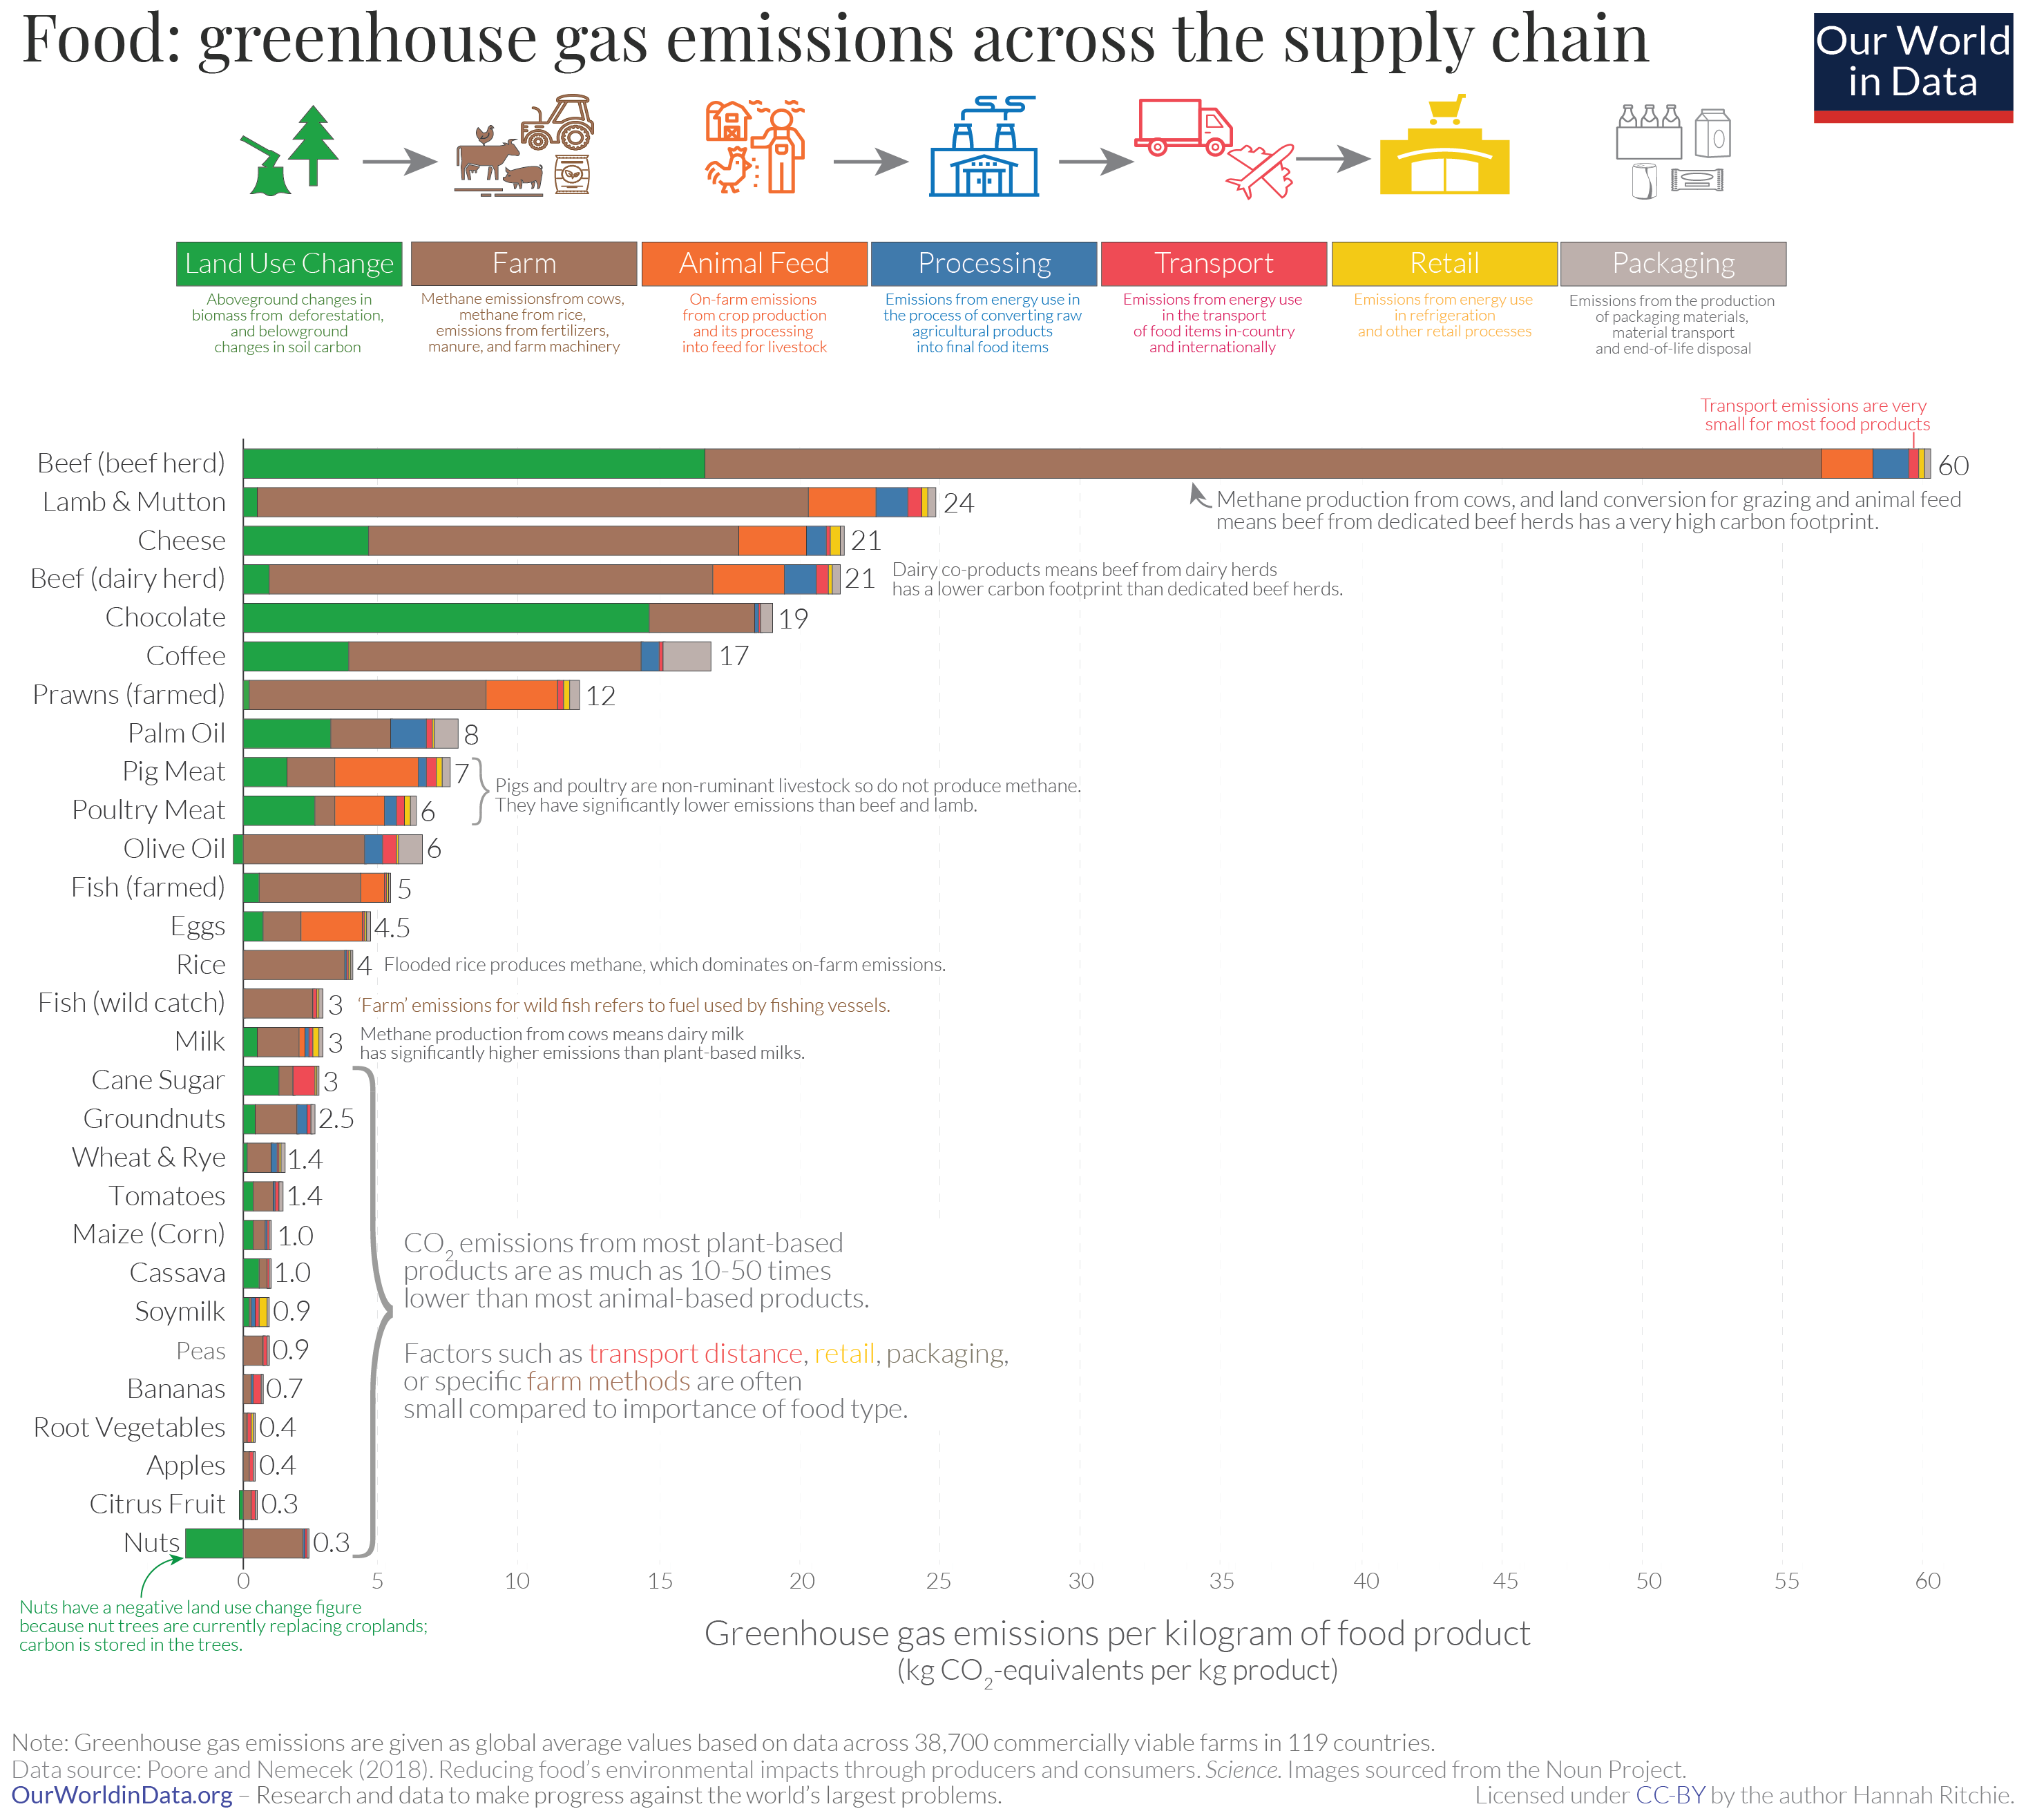
If you feel guilty about the carbon emissions from your bananas imported from the tropics, don’t. The carbon emissions of transporting that crop to you is negligible when you look at the whole supply chain. Its better to focus on reducing your consumption of carbon-intensive foods – particularly meat.
Random things
These links are meant to make you think about the things that affect our world in transport, and not just think about transport itself. I hope that you enjoy them.
Can 3-D Printing Help Solve the Housing Crisis? (New Yorker)
Davos: There’s life in global capitalism yet (Financial Times)
Culture Study Challenge: One Small Community Thing (Culture Study)
Don’t ban ChatGPT in schools, but teach with it (Straits Times)
Something interesting
Yes, its the Bird Site (I promise this won’t happen again). But this graphic about shifting car ownership and use from zoomers to Boomers is very, very good. Here’s the article where it is from.